File:Asymmetricwave2.png

Size of this preview: 800 × 599 pixels. Other resolutions: 320 × 240 pixels | 640 × 479 pixels | 1,024 × 767 pixels | 1,280 × 958 pixels | 1,814 × 1,358 pixels.
Original file (1,814 × 1,358 pixels, file size: 505 KB, MIME type: image/png)
| This is a file from the Wikimedia Commons. The description on its description page there is shown below.
|
Summary
| Description |
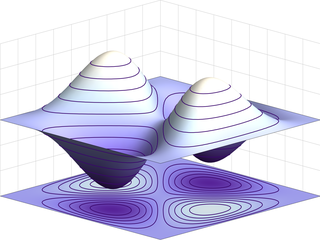
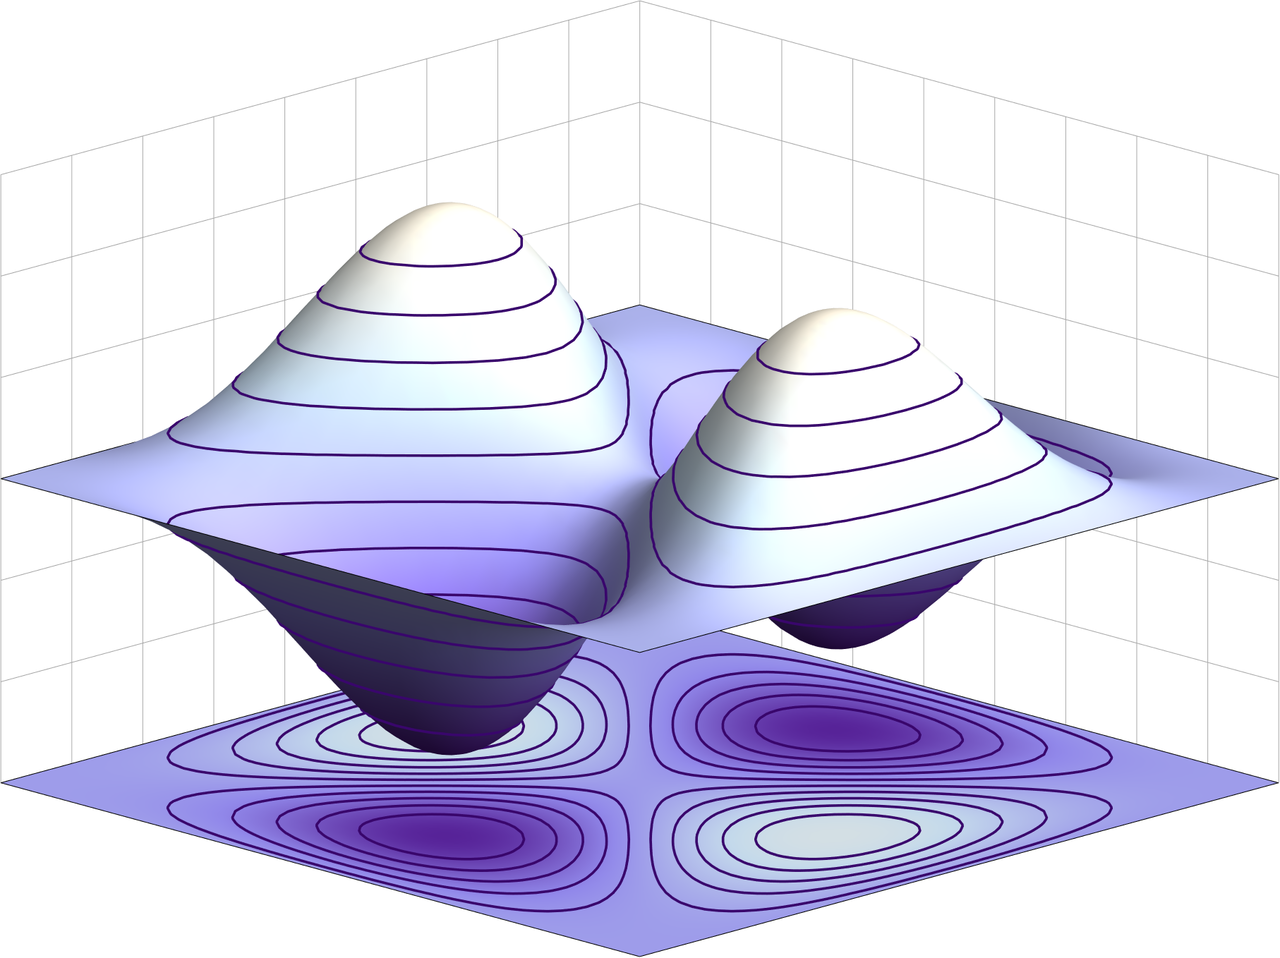
English: Asymmetric wavefunction for a (fermionic) 2-particle state in a one-dimensional square well potential of infinite depth. The 3D graph shows the wavefunction for the 2-particle fermionic first excited state for the square well, with each horizontal axis giving one particle's position. |
| Source |
Own work using:
|
| Author | TimothyRias |
Licensing
I, the copyright holder of this work, hereby publish it under the following license:
This file is licensed under the Creative Commons Attribution 3.0 Unported license.
- You are free:
- to share – to copy, distribute and transmit the work
- to remix – to adapt the work
- Under the following conditions:
- attribution – You must give appropriate credit, provide a link to the license, and indicate if changes were made. You may do so in any reasonable manner, but not in any way that suggests the licensor endorses you or your use.
Code
&Assumptions = {n \[Element] Integers, m \[Element] Integers};
f[n_, x_] := Sqrt[2] Sin[n \[Pi] x]
a[n_, m_] := Function[{x, y}, (f[n, x] f[m, y] - f[n, y] f[m, x])/Sqrt[2]];
awave2 = Plot3D[Evaluate[a[1, 3][x, y]], {x, 0, 1}, {y, 0, 1},
  PlotPoints -> 35,
  PlotRange -> {-2.5, 3.5},
  MeshFunctions -> {#3 &},
  Mesh -> 10,
  MeshStyle ->
   Directive[ColorData["DeepSeaColors"][.1], Thickness[.002]],
  ColorFunction -> "LakeColors",
  BoxRatios -> {1, 1, .7},
  Boxed -> False,
  Axes -> False];
agroundplot = Plot3D[-3, {x, 0, 1}, {y, 0, 1},
  MeshFunctions -> {a[1, 3][#1, #2] &},
  Mesh -> 10,
  MeshStyle ->
   Directive[ColorData["DeepSeaColors"][.1], Thickness[.002]],
  PlotPoints -> 50,
  ColorFunction -> (ColorData["LakeColors"][(a[1, 3][#1, #2] + 2.5)/
      6] &)
  ];
awave3 = Show[{awave2, agroundplot},
 PlotRange -> {{0, 1}, {0, 1}, {-3, 3}},
 Axes -> None,
 PlotRangePadding -> None,
 ImagePadding -> 1,
 FaceGrids -> {
   {{-1, 0, 0}, {Table[i, {i, 0, 1, 1/9}],
     Table[i, {i, -3, 3, 1}]}},
   {{0, -1, 0}, {Table[i, {i, 0, 1, 1/9}], Table[i, {i, -3, 3, 1}]}}
   },
 ViewPoint -> 1000 {5, 5, 2},
 ViewVertical -> {0, 0, 1},
 ViewCenter -> {.5, .5, 0},
 ImageSize -> 600]
Export["Asymmetricwave2.png", awave3, "PNG"]
File history
Click on a date/time to view the file as it appeared at that time.
| Date/Time | Dimensions | User | Comment | |
|---|---|---|---|---|
| current | 07:58, 4 April 2023 | 1,814 × 1,358 (505 KB) | Jähmefyysikko | Higher resolution image |
File usage
The following page uses this file: