File:COVID-19 Finland timeline.en.svg

Size of this PNG preview of this SVG file: 800 × 500 pixels. Other resolutions: 320 × 200 pixels | 640 × 400 pixels | 1,024 × 640 pixels | 1,280 × 800 pixels | 1,440 × 900 pixels.
Original file (SVG file, nominally 1,440 × 900 pixels, file size: 502 KB)
| This is a file from the Wikimedia Commons. The description on its description page there is shown below.
|
Summary

|
This file may be updated to reflect new information. If you wish to use a specific version of the file without new updates being mirrored, please upload the required version as a separate file. |
| Description |
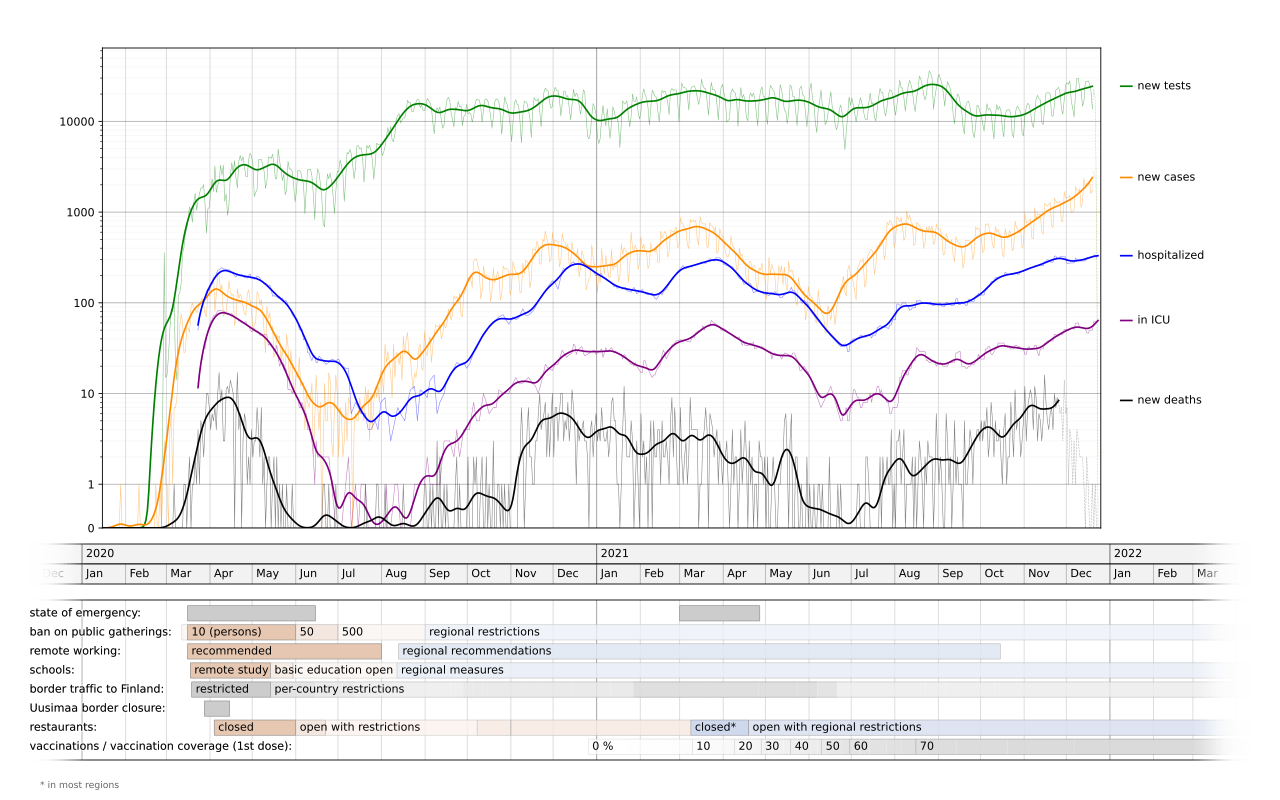
English: The upper part of the image shows the per-day numbers of new tests, new confirmed cases and new deaths, as well as the numbers of patiens that were hospitalized or in ICU. Each curve has two versions: the thin curve that shows the raw data and the thick curve that has been smoothed using local linear kernel regression. The y-axis is logarithmic above 1.
In addition, the dates of some important decisions are shown annotated, and the bottom part of the image shows the date ranges of some restrictions. |
| Date | |
| Source | Own work |
| Author | Tmn |
| Other versions |
|
| Data sources |

Licensing
I, the copyright holder of this work, hereby publish it under the following license:
This file is licensed under the Creative Commons Attribution-Share Alike 4.0 International license.
- You are free:
- to share – to copy, distribute and transmit the work
- to remix – to adapt the work
- Under the following conditions:
- attribution – You must give appropriate credit, provide a link to the license, and indicate if changes were made. You may do so in any reasonable manner, but not in any way that suggests the licensor endorses you or your use.
- share alike – If you remix, transform, or build upon the material, you must distribute your contributions under the same or compatible license as the original.
File history
Click on a date/time to view the file as it appeared at that time.
| Date/Time | Dimensions | User | Comment | |
|---|---|---|---|---|
| current | 06:56, 23 December 2021 | 1,440 × 900 (502 KB) | Tmn | update (data only, no actions) |
File usage
The following page uses this file: