File:Exoplanet Period-Mass Scatter Discovery Method TR.png
Original file (1,600 × 1,920 pixels, file size: 79 KB, MIME type: image/png)
| This is a file from the Wikimedia Commons. The description on its description page there is shown below.
|
Summary
| Description |
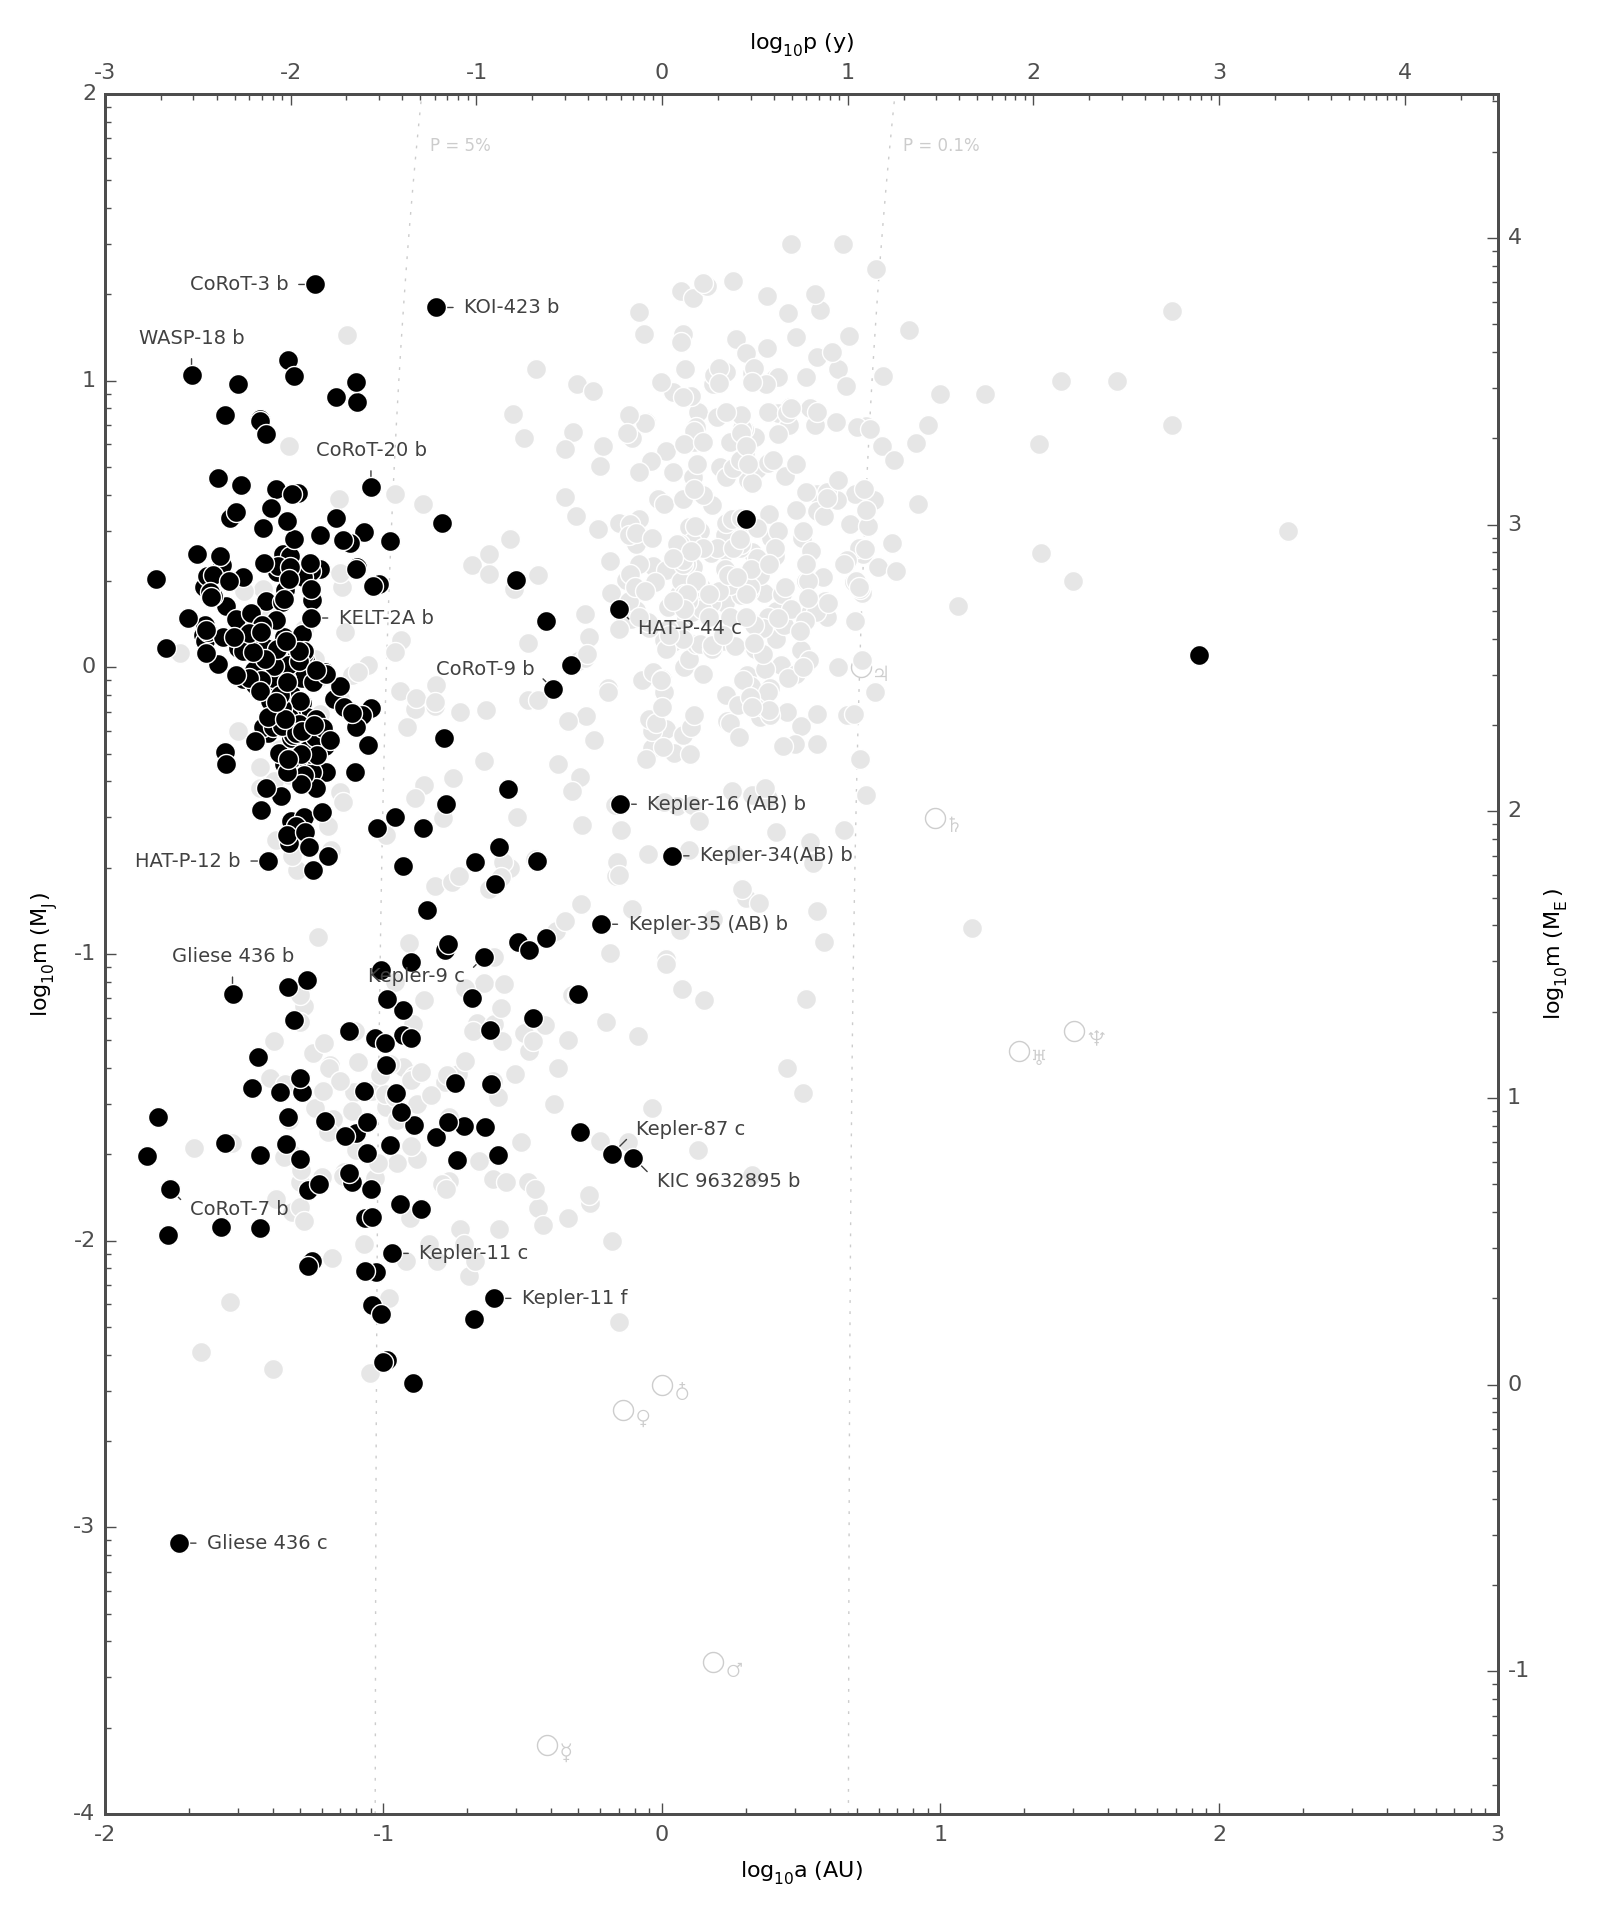
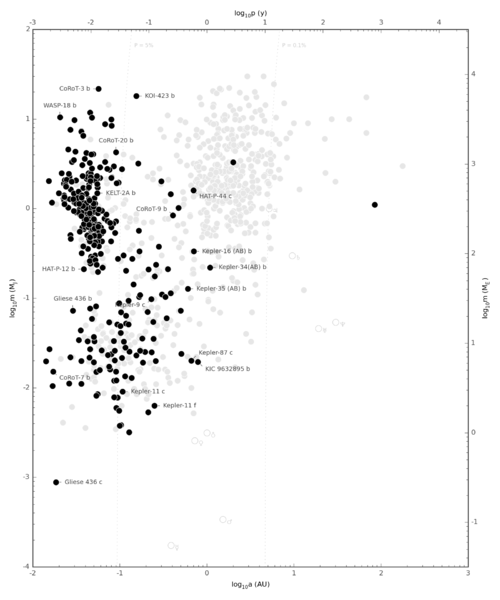
English: Scatter plot of mass, m, and semimajor axis, a, for exoplanet discoveries through 2014-09-23, indicating planets detected using transits:
detected using transits (black)
detected using other methods
Solar System planets for reference
Estimates (see "important note" below) of m and a are indicated with circles. Scales indicate (log10 of) mass, m, expressed as Jupiter masses (left) and Earth masses (right); and (log10 of) semimajor axis, a, expressed in AU (bottom), and the corresponding period, p for a planet orbiting a Sun-mass star, expressed in Earth years. Reference lines are provided as a rough measure of the difficulty of detecting exoplanets using transits. Dashed lines trace the m (for Jupiter-density) and a values where the geometric probability, P, of transit for a solar-radius star (assuming a circular orbit, so that e and ω can be ignored) is the indicated value (less than the indicated proportion of all planets to the right of a given line will have transiting orbits). Exoplanet data is from the Open Exoplanet Catalogue,[1] version 811d352, including some (mostly from the Kepler mission) whose semi major axes are computed from period data. The figure excludes 4 planets with semimajor axes outside the range of the figure and 1 (PSR B1257+12 b) with a mass lower than the range of the figure. Important note: This figure is intended to serve as a visualization of the catalog of generally accepted candidate exoplanets using the distribution of some of their basic properties related to detection. No attempt has been made to characterize the degree of confidence (which varies widely) in the existence of a given planet or its properties. Nor is any attempt made to convey systematic errors associated with a particular method. In particular, the indicated mass, m, for an exoplanet characterized using radial velocity is the minimum mass (so that the actual distrubiton of masses for non-transiting planets may be shifted and "smeared" significantly upward).
|
| Date | |
| Source | Own work, based on a figure by E.A.L. and used with permission |
| Author | Aldaron, a.k.a. Aldaron |
| Other versions |
Other versions
Graphs for individual methods
Related graphs
|


Licensing:
| I, the copyright holder of this work, release this work into the public domain. This applies worldwide. In some countries this may not be legally possible; if so: I grant anyone the right to use this work for any purpose, without any conditions, unless such conditions are required by law. |
File history
Click on a date/time to view the file as it appeared at that time.
| Date/Time | Dimensions | User | Comment | |
|---|---|---|---|---|
| current | 15:10, 26 September 2016 | 1,600 × 1,920 (79 KB) | Cmdrjameson | Compressed with pngout. Reduced by 187kB (70% decrease). |
File usage
The following page uses this file: