File:Tamasol SVG.svg

Size of this PNG preview of this SVG file: 600 × 600 pixels. Other resolutions: 240 × 240 pixels | 480 × 480 pixels | 768 × 768 pixels | 1,024 × 1,024 pixels | 720 × 720 pixels.
Original file (SVG file, nominally 720 × 720 pixels, file size: 27 KB)
| This is a file from the Wikimedia Commons. The description on its description page there is shown below.
|
Summary
| Description |
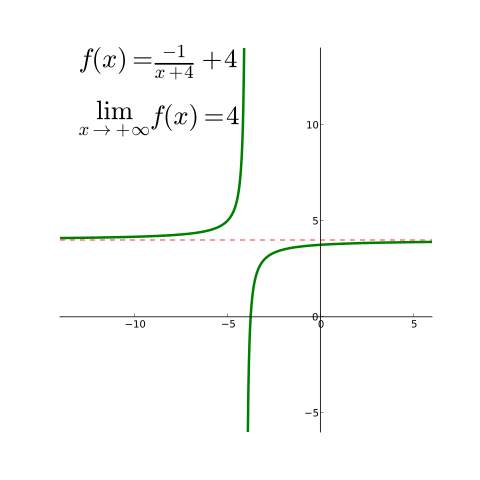
English: SVG version of illustration of limit of function at infinity point. Source code available. |
| Date | |
| Source | Own work |
| Author | IkamusumeFan |
| SVG development | This plot was created with Matplotlib. |
| Source code | Python code# Author: Ika, 2013-07-26
from pylab import *
import pylab as pl
import numpy as np
# Create a figure of size 8x6 points, 80 dots per inch
pl.figure(figsize=(8,8), dpi=80)
# Create a plot of the cubic function y=-1/(x+4)+4
x = np.linspace(-14.0,-4.0,1024, endpoint=True)
y = -1/(x+4)+4
pl.plot(x,y,color="green", linewidth=3.0, linestyle="-")
x = np.linspace(-4.0,6.0,1024, endpoint=True)
y = -1/(x+4)+4
pl.plot(x,y,color="green", linewidth=3.0, linestyle="-")
# Draw the limit line
x = np.linspace(-14.0,6.0,1024, endpoint=True)
y = 4+0*x
pl.plot(x,y,color="red", linewidth=1.0, linestyle="--")
# Set labels
pl.xlim(-14.0,6.0)
pl.ylim(-6.0,14.0)
# Move the spines
ax = pl.gca()
ax.set_xlabel('x')
ax.set_ylabel('y')
ax.text(-13, 13, r'$f(x)=\frac{-1}{x+4}+4$', fontsize=32)
ax.text(-13, 10, r'$\lim_{x\rightarrow +\infty}f(x)=4$', fontsize=32)
# Set up the spines
ax.spines['right'].set_color('none')
ax.spines['top'].set_color('none')
ax.xaxis.set_ticks_position('bottom')
ax.spines['bottom'].set_position(('data',0))
ax.yaxis.set_ticks_position('left')
ax.spines['left'].set_position(('data',0))
# Save the figure to the output SVG file
plt.savefig("Tamasol_SVG.svg");
|
Licensing
I, the copyright holder of this work, hereby publish it under the following license:
This file is licensed under the Creative Commons Attribution-Share Alike 3.0 Unported license.
- You are free:
- to share – to copy, distribute and transmit the work
- to remix – to adapt the work
- Under the following conditions:
- attribution – You must give appropriate credit, provide a link to the license, and indicate if changes were made. You may do so in any reasonable manner, but not in any way that suggests the licensor endorses you or your use.
- share alike – If you remix, transform, or build upon the material, you must distribute your contributions under the same or compatible license as the original.
File history
Click on a date/time to view the file as it appeared at that time.
| Date/Time | Dimensions | User | Comment | |
|---|---|---|---|---|
| current | 02:41, 26 July 2013 | 720 × 720 (27 KB) | IkamusumeFan | User created page with UploadWizard |
File usage
The following page uses this file: