File:Interferenz.jpg
Original file (2,000 × 2,000 pixels, file size: 634 KB, MIME type: image/jpeg)
| This is a file from the Wikimedia Commons. The description on its description page there is shown below.
|
Summary
| Description |
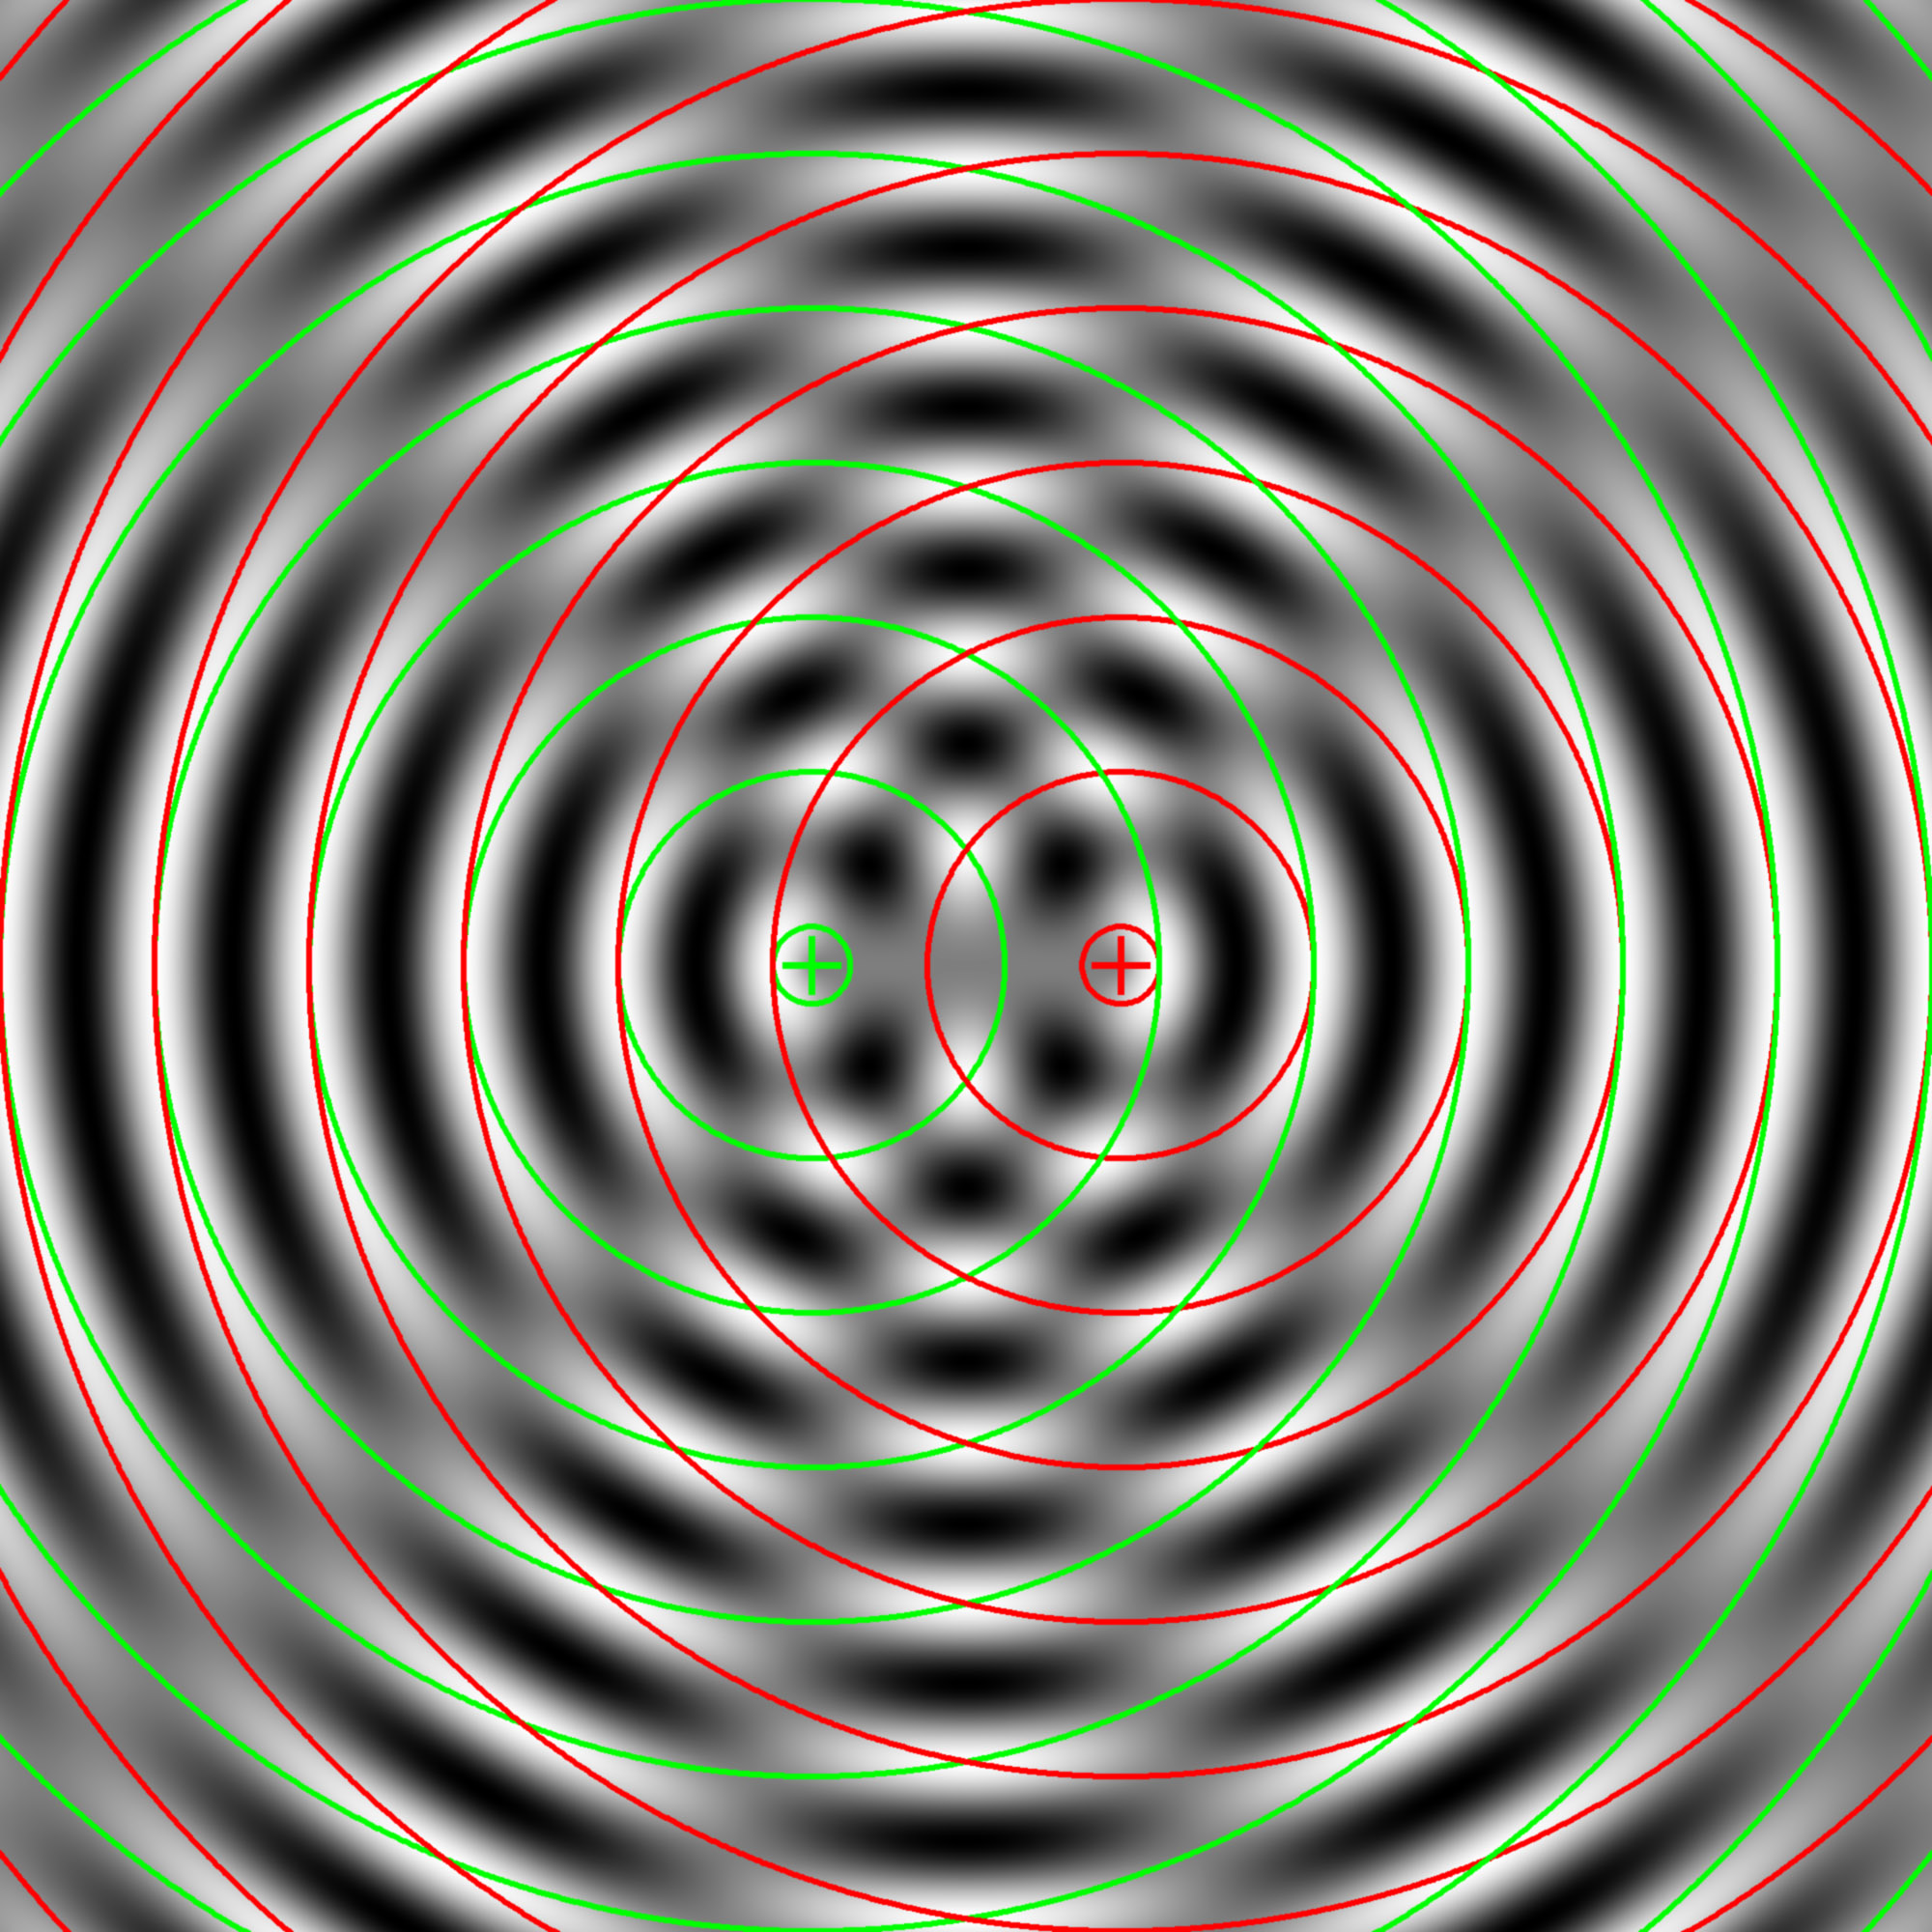
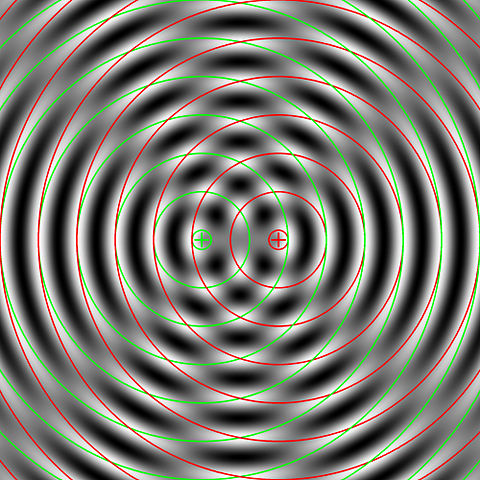
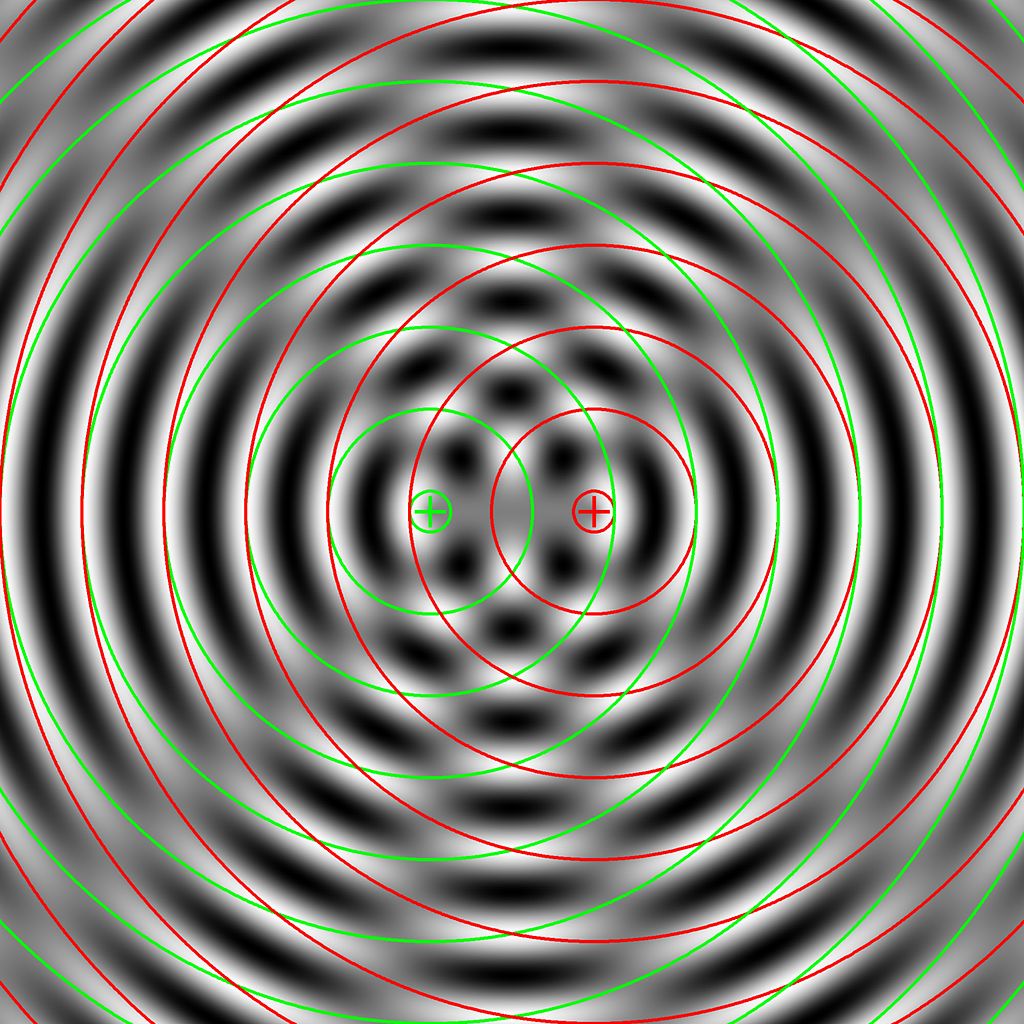
Deutsch: Simuliertes Interferenzbild zweier punktförmiger Quellen mit gleicher Wellenlänge. Die Lagen der Quellen sind durch Kreuze gekennzeichnet, die Maxima beider Wellen durch farbige Kreise. |
| Date | |
| Source | Own work |
| Author | Dr. Schorsch 12:32, 19 Apr 2005 (UTC) (Dr. Schorsch (talk)) |
Licensing

|
Permission is granted to copy, distribute and/or modify this document under the terms of the GNU Free Documentation License, Version 1.2 or any later version published by the Free Software Foundation; with no Invariant Sections, no Front-Cover Texts, and no Back-Cover Texts. A copy of the license is included in the section entitled GNU Free Documentation License. |
- You are free:
- to share – to copy, distribute and transmit the work
- to remix – to adapt the work
- Under the following conditions:
- attribution – You must give appropriate credit, provide a link to the license, and indicate if changes were made. You may do so in any reasonable manner, but not in any way that suggests the licensor endorses you or your use.
- share alike – If you remix, transform, or build upon the material, you must distribute your contributions under the same or compatible license as the original.
Source Code
This is the source code of the program I used to create this image. Click on “Show source code” to display it.
The following program is under the GNU General Public License (GPL).
|
|
This work is free software; you can redistribute it and/or modify it under the terms of the GNU General Public License as published by the Free Software Foundation; either version 2 of the License, or any later version. This work is distributed in the hope that it will be useful, but without any warranty; without even the implied warranty of merchantability or fitness for a particular purpose. See version 2 and version 3 of the GNU General Public License for more details. |
; Program Written in IDL (Interactive Data Language)
; Free Interpreter availible at www.rsinc.com
; Written by Georg Wiora
; This Program is under the  GNU General Public License (GPL)
;
; Create a display of interference patterns
; Save this text as file "Interference2.pro" to run it.

; Draw a circle
PRO circle,x,y,r,_REF_EXTRA=ex
  n=ULONG(!DPI*r) > 1
  phi = FINDGEN(n)/FLOAT(n)*2*!DPI
  x1 = r*COS(phi)+x
  y1 = r*SIN(phi)+y
  PLOTS,[x1,x1[0]],[y1,y1[0]],_STRICT_EXTRA=ex
END

; Compute the interference
PRO Interference2
   ; Final Image Size
  siz=2000
  ; No display if larger than 800x1600 pixel
  pixmap=SIZ GT 800
  ; Wavelength in Pixel
  lambda=160
  ; Half distance of the sources
  dhalb = lambda

  ; Compute the distance of each point in an array from the
  ; center point: This is the phase of the signal
  d1 = SHIFT(DIST(siz*2,siz),siz,siz/2)
  ; Sinus of distace with 0 LE amplitude LE 2
  f = SIN(d1/lambda*2*!DPI)+1
  ; Compute Interference
  inter = SHIFT(f,-dhalb,0)+SHIFT(f,dhalb,0)
  ; Get maximum and minimum
  ma = MAX(inter,MIN=mi)
  ; Two colors are reserved for marking, the rest is gray scale
  ; Scale interference to byte range [0..253]
  inter = BYTE((TEMPORARY(inter)-mi)/(ma-mi)*253)

  ; Use lookup table to display
  DEVICE,DECOMPOSED=0
  ; Gray scale
  LOADCT,0
  ; Half length of center cross bars in pixel
  cs=30
  ; Half width of center cross bars in pixel
  cb=3

  ; Set mark for center
  ; Horizontal left
  inter[siz-dhalb-cs:siz-dhalb+cs, siz/2-cb:siz/2+cb] = 254
  ; Vertical left
  inter[siz-dhalb-cb:siz-dhalb+cb, siz/2-cs:siz/2+cs] = 254
  ; Horizontal right
  inter[siz+dhalb-cs:siz+dhalb+cs, siz/2-cb:siz/2+cb] = 255
  ; Vertical right
  inter[siz+dhalb-cb:siz+dhalb+cb, siz/2-cs:siz/2+cs] = 255

  ; Open a visible or invisible window (depends on pixmap flag)
  WINDOW,XSIZE=2*siz,YSIZE=siz,PIXMAP=pixmap
  ; Display the interference (only gray scale!)
  TV,inter
  ; Draw circles on maximum locations
  FOR i=0,2.5*siz/lambda DO $
  BEGIN
    ; Maximum location left
    circle,siz-dhalb,siz/2,(i+0.25)*lambda,THICK=6,/DEVICE,COLOR=254
    ; Maximum location right
    circle,siz+dhalb,siz/2,(i+0.25)*lambda,THICK=6,/DEVICE,COLOR=255
  ENDFOR

  ; Colortable 0-253 as gray scake
  r = FINDGEN(256)/253*255
  g=r
  b=r
  ; 254 is green
  r[254]=0
  b[254]=0
  g[254]=255
  ; 255 is red
  r[255]=255
  b[255]=0
  g[255]=0

  ; Read image from display
  im=TVRD()
  ; Crop invalid borders
  im = im[siz/2:3*siz/2-1,*]

  ; Save as PNG with colortable
  WRITE_PNG,'Interference2.png',im,r,g,b
  ; Convert to truecolor and write JPEG
  imt = [[[r[im]]],[[g[im]]],[[b[im]]]]
  ; smooth image a little bit (saves bandwith in jpeg and is OK
  ; with high resolution)
  imt[*,*,0] = SMOOTH(imt[*,*,0],3,/EDGE_TRUNCATE)
  imt[*,*,1] = SMOOTH(imt[*,*,1],3,/EDGE_TRUNCATE)
  imt[*,*,2] = SMOOTH(imt[*,*,2],3,/EDGE_TRUNCATE)
  ; Write as jpeg
  WRITE_JPEG,'Interference2.jpg',TEMPORARY(imt),/PROGRESSIVE,$
             QUALITY=90, TRUE=3
END
File history
Click on a date/time to view the file as it appeared at that time.
| Date/Time | Dimensions | User | Comment | |
|---|---|---|---|---|
| current | 07:26, 19 April 2005 | 2,000 × 2,000 (634 KB) | Xorx |
File usage
The following page uses this file: