File:1850- Warming stripes - global average surface temperature.svg

Size of this PNG preview of this SVG file: 800 × 450 pixels. Other resolutions: 320 × 180 pixels | 640 × 360 pixels | 1,024 × 576 pixels | 1,280 × 720 pixels | 1,200 × 675 pixels.
Original file (SVG file, nominally 1,200 × 675 pixels, file size: 9 KB)
| This is a file from the Wikimedia Commons. The description on its description page there is shown below.
|
Summary
| Description |
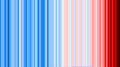
English: w:Warming stripes graphic showing global average surface temperature starting in 1850
Deutsch: Streifengrafik zeigt die globale durchschnittliche Oberflächentemperatur ab 1850 |
| Date | |
| Source | Own work (based on w:Warming stripes graphic design concept invented by w:Ed Hawkins (climatologist)) |
| Author | RCraig09 |
Related files
-
 20190705 Warming stripes - Berkeley Earth (world) - avg above- and below-ice readings.png
PNG predecessor (early version, not using ColorBrewer hues) -
 1850- Warming stripes - global average surface temperature.svg
SVG successor -
 20190705 Warming stripes BEHIND line graph - Berkeley Earth (world).png
PNG predecessor (early version, not using ColorBrewer hues) -
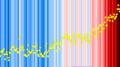
 20240311 Warming stripes BEHIND line chart - global surface temperature.svg
SVG - warming stripes behind conventional line chart -
 20240625 Global warming across generations - warming stripes.svg
warming stripes juxtaposed with generations in history -
 Generation_timeline.svg
2020-, relevant to timing of different generations -
 20181204 Warming stripes (global, WMO, 1850-2018) - Climate Lab Book (Ed Hawkins).svg
The early (2018) image from Ed Hawkins' online Climate Lab Book. (This image was a finalist in Picture of the Year 2023 and is a featured picture on Wikimedia Commons.)
_-_avg_above-_and_below-ice_readings.png)

.png)


Licensing
I, the copyright holder of this work, hereby publish it under the following license:
This file is licensed under the Creative Commons Attribution-Share Alike 4.0 International license.
- You are free:
- to share – to copy, distribute and transmit the work
- to remix – to adapt the work
- Under the following conditions:
- attribution – You must give appropriate credit, provide a link to the license, and indicate if changes were made. You may do so in any reasonable manner, but not in any way that suggests the licensor endorses you or your use.
- share alike – If you remix, transform, or build upon the material, you must distribute your contributions under the same or compatible license as the original.
File history
Click on a date/time to view the file as it appeared at that time.
| Date/Time | Dimensions | User | Comment | |
|---|---|---|---|---|
| current | 21:43, 6 August 2025 | 1,200 × 675 (9 KB) | RCraig09 | Version 2: update to include data for 2024; revise from 0.12 to 0.125 degrees C per colour band |
File usage
The following page uses this file: