File:20201112 Tidal flooding graph - Annapolis, Maryland.svg

Size of this PNG preview of this SVG file: 800 × 600 pixels. Other resolutions: 320 × 240 pixels | 640 × 480 pixels | 1,024 × 768 pixels | 1,280 × 960 pixels | 900 × 675 pixels.
Original file (SVG file, nominally 900 × 675 pixels, file size: 2 KB)
| This is a file from the Wikimedia Commons. The description on its description page there is shown below.
|
Summary
| Description |
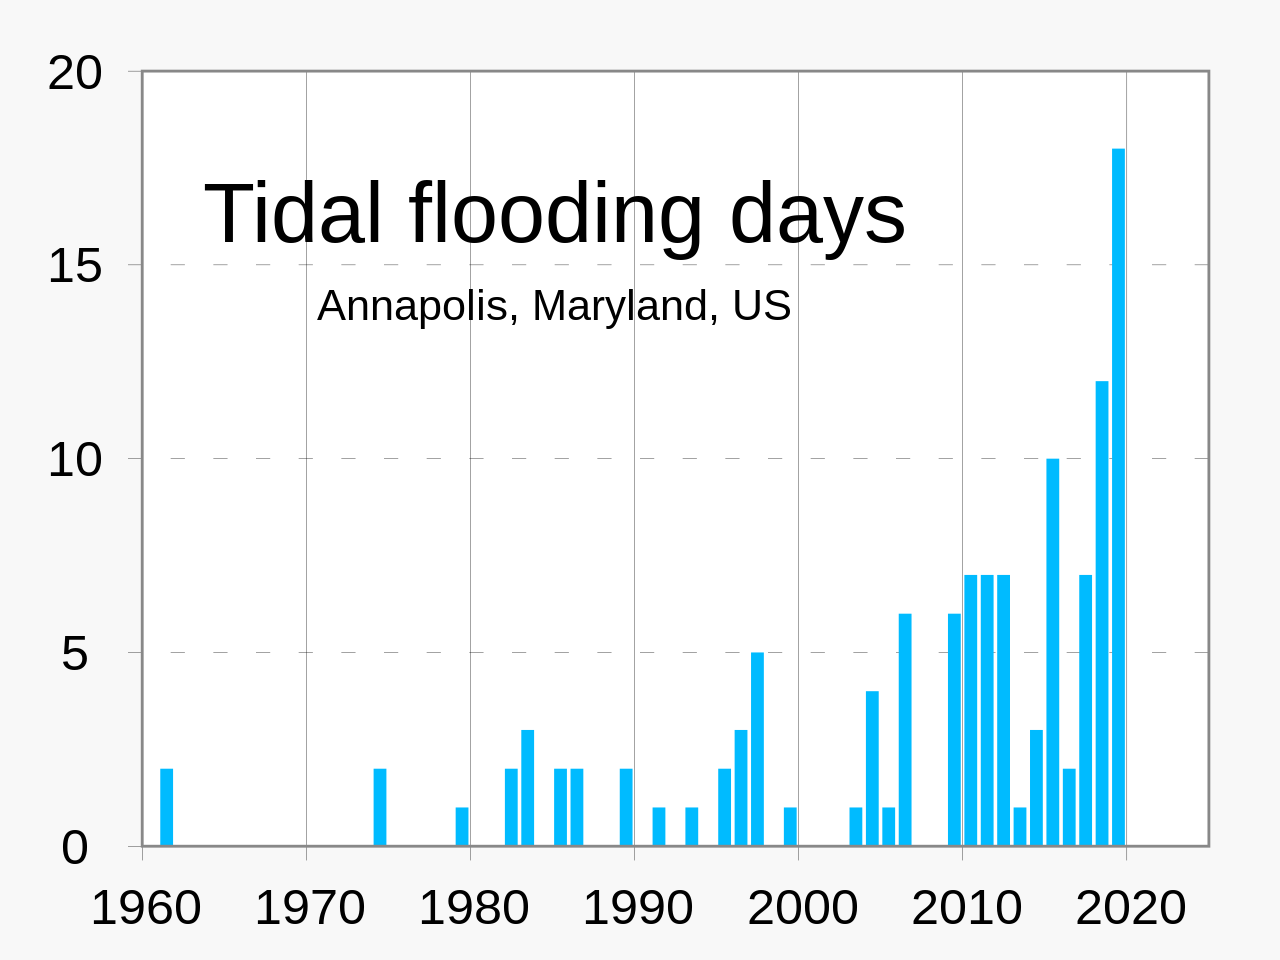
English: Column graph (bar chart) of number of days of tidal flooding per year in Annapolis, Maryland, U.S.
|
||
| Date | |||
| Source | Own work | ||
| Author | RCraig09 |

Related files
-
 1950- High tide flooding, by year - NOAA tide gauges (U.S.).svg (uploaded Nov. 2022)
.svg)
Licensing
I, the copyright holder of this work, hereby publish it under the following license:
This file is licensed under the Creative Commons Attribution-Share Alike 4.0 International license.
- You are free:
- to share – to copy, distribute and transmit the work
- to remix – to adapt the work
- Under the following conditions:
- attribution – You must give appropriate credit, provide a link to the license, and indicate if changes were made. You may do so in any reasonable manner, but not in any way that suggests the licensor endorses you or your use.
- share alike – If you remix, transform, or build upon the material, you must distribute your contributions under the same or compatible license as the original.
File history
Click on a date/time to view the file as it appeared at that time.
| Date/Time | Dimensions | User | Comment | |
|---|---|---|---|---|
| current | 13:05, 8 November 2022 | 900 × 675 (2 KB) | RCraig09 | Version 2: recreate using leaner code using Vertical Bar Chart spreadsheet linked at User:RCraig09/Excel to XML for SVG |
File usage
The following page uses this file: