File:AppleAppStoreStatistics.png

Size of this preview: 800 × 556 pixels. Other resolutions: 320 × 222 pixels | 640 × 444 pixels | 1,024 × 711 pixels | 1,316 × 914 pixels.
Original file (1,316 × 914 pixels, file size: 107 KB, MIME type: image/png)
| This is a file from the Wikimedia Commons. The description on its description page there is shown below.
|
Summary
| Description |
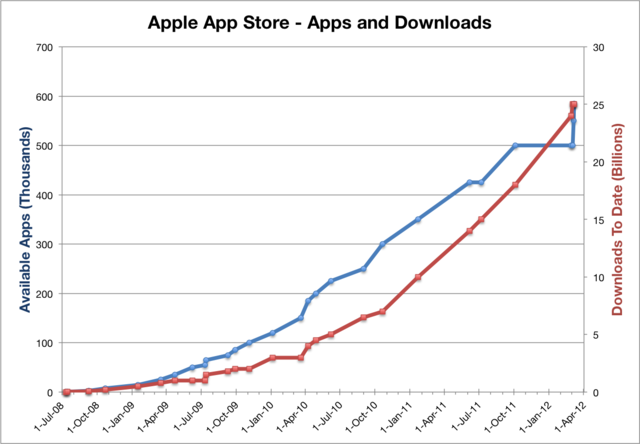
English: Chart showing downloads and available apps on the app store over time, since the App Store was opened in 2008. |
| Date | (UTC) |
| Source | I (W3bbo (talk)) created this work entirely by myself based on the data provided on the App Store article. |
| Author | W3bbo (talk) |
| Permission (Reusing this file) |
8.(5.9)M. |
| Other versions | NeyT!vE |

|
This chart image could be re-created using vector graphics as an SVG file. This has several advantages; see Commons:Media for cleanup for more information. If an SVG form of this image is available, please upload it and afterwards replace this template with
{{vector version available|new image name}}.
It is recommended to name the SVG file “AppleAppStoreStatistics.svg”—then the template Vector version available (or Vva) does not need the new image name parameter. |
Licensing
W3bbo at the English Wikipedia, the copyright holder of this work, hereby publishes it under the following license:

|
Permission is granted to copy, distribute and/or modify this document under the terms of the GNU Free Documentation License, Version 1.2 or any later version published by the Free Software Foundation; with no Invariant Sections, no Front-Cover Texts, and no Back-Cover Texts. A copy of the license is included in the section entitled GNU Free Documentation License. |
Original upload log
The original description page was here. All following user names refer to en.wikipedia.
| Date/Time | Dimensions | User | Comment |
|---|---|---|---|
| 2012-05-14 10:01 | 1316×914× (122728 bytes) | Smileyborg | Updated using latest info from App Store (iOS) Wikipedia page, data under "Milestones". For numbers with a plus sign next to them, I chose to graph the minimum point. (i.e. 500,000+ would be graphed at simply 500,000). |
| 2010-11-14 23:24 | 1296×849× (27512 bytes) | W3bbo | Updated the chart to show data for 2009 and 2010. |
| 2010-07-15 22:54 | 875×575× (43054 bytes) | W3bbo | {{Information |Description = Chart showing downloads and available apps on the app store over time, since the App Store was opened in 2008. |Source = I (~~~) created this work entirely by myself based on the data provided on the [[App Store]] |
File history
Click on a date/time to view the file as it appeared at that time.
| Date/Time | Dimensions | User | Comment | |
|---|---|---|---|---|
| current | 23:55, 27 November 2016 | 1,316 × 914 (107 KB) | Numbermaniac | -11% filesize |
File usage
The following page uses this file: