File:Carbon dioxide emissions from fuel combustion of Annex I Kyoto Protocol Parties 1990-2009.png

Original file(1,077 × 603 pixels, file size: 28 KB, MIME type: image/png)

Commons-logo.svg This is a file from the Wikimedia Commons. The description on its description page there is shown below.
Commons is a freely licensed media file repository. You can help.

Summary

Description
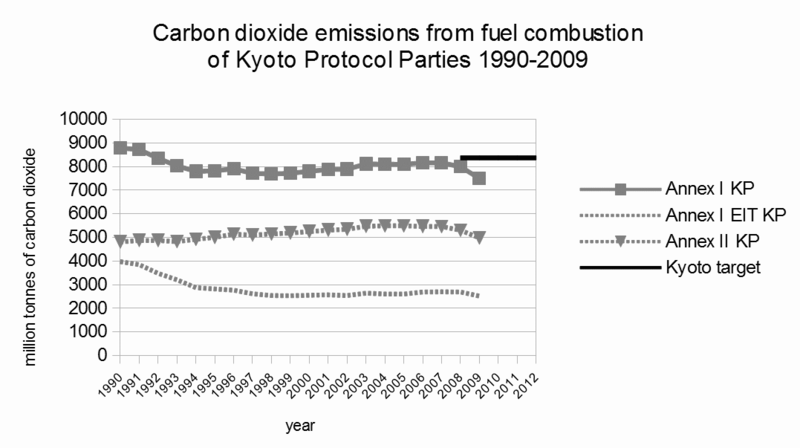
English: This graph shows the carbon dioxide (CO2) emissions from fuel combustion of Annex I Kyoto Protocol Parties between 1990 and 2009. The 2008-2012 Kyoto target is also plotted. The graph is based on data from the International Energy Agency (IEA, 2011). The Kyoto target is calculated as a percentage of 1990 CO2 emissions from fuel combustion only. It therefore does not represent the total target for the six-gas basket (see Kyoto Protocol for details). The target as presented here assumes that the reduction targets are spread equally across all gases (IEA, 2011).

The graph shows that the emissions of Annex I Kyoto Protocol (KP) Parties have been uneven between 1990 and 2009. In 1990, emissions were about 8,800 million tonnes (Mt) CO2, declined then stabilized over the 1990s, grew slowly in the 2000s, reaching about 8,100 MtCO2 in 2007, then fell to about 7,500 MtCO2 in 2009. Emissions in 2008 and 2009 were below the Kyoto target of about 8,400 MtCO2, which applies between 2008-2012.

For Annex I "Economies in Transition" (EIT) KP Parties (i.e., the former economies of the Soviet Union), emissions declined between 1990-1999 (1990 emissions = about 4,000 MtCO2; 1999 emissions = about 2,500 MtCO2), grew slowly up to 2007 (2007 emissions = about 2,700 MtCO2), and then declined in 2009 (about 2,500 MtCO2).

For Annex II KP Parties (i.e., Annex I KP Parties minus the EIT KP Parties), emissions in 1990 were about 4,800 MtCO2, gradually increased and peaked around 2004 (about 5,500 MtCO2), before falling to about 5,000 MtCO2 in 2009.

References: CO2 Emissions From Fuel Combustion: Highlights (2011 edition), author: International Energy Agency (IEA), publisher: IEA, Paris, France, p.13. The IEA has made data from this publication freely available to download as an Excel (XLS) spreadsheet (1,008 KB).
Date
Source Own work
Author Enescot

Licensing

I, the copyright holder of this work, hereby publish it under the following licenses:
w:en:Creative Commons
attribution share alike
This file is licensed under the Creative Commons Attribution-Share Alike 3.0 Unported license.
You are free:
  • to share – to copy, distribute and transmit the work
  • to remix – to adapt the work
Under the following conditions:
  • attribution – You must give appropriate credit, provide a link to the license, and indicate if changes were made. You may do so in any reasonable manner, but not in any way that suggests the licensor endorses you or your use.
  • share alike – If you remix, transform, or build upon the material, you must distribute your contributions under the same or compatible license as the original.
GNU head Permission is granted to copy, distribute and/or modify this document under the terms of the GNU Free Documentation License, Version 1.2 or any later version published by the Free Software Foundation; with no Invariant Sections, no Front-Cover Texts, and no Back-Cover Texts. A copy of the license is included in the section entitled GNU Free Documentation License.
You may select the license of your choice.

Captions

Add a one-line explanation of what this file represents

Items portrayed in this file

depicts

18 September 2012

image/png

3008a85c5d3d861820b91dac8a3e6642bac68d61

28,494 byte

603 pixel

1,077 pixel

File history

Click on a date/time to view the file as it appeared at that time.

Date/TimeDimensionsUserComment
current21:34, 17 September 20121,077 × 603 (28 KB)Enescot{{Information |Description ={{en|1=This graph shows the carbon dioxide (CO<sub>2</sub>) emissions from fuel combustion of Annex I [[:en:Kyoto Prot...

The following page uses this file: