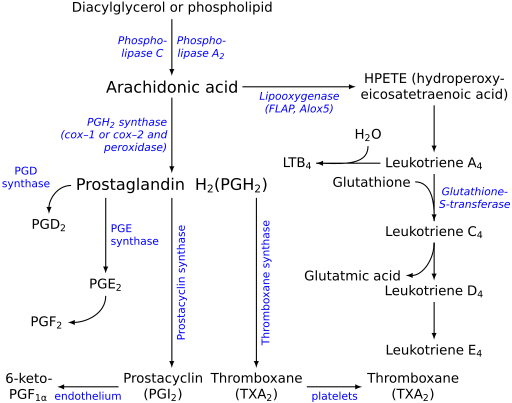
File:Eicosanoid synthesis.svg
Original file(SVG file, nominally 512 × 403 pixels, file size: 9 KB)

Commons-logo.svg This is a file from the Wikimedia Commons. The description on its description page there is shown below.
Commons is a freely licensed media file repository. You can help.
Description Ghost of w:Image:Eicosanoid_synthesis.png, as requested.
Date
Source w:Image:Eicosanoid_synthesis.png
Author Jfdwolff, whitespace removed by Fvasconcellos, recreated with editable text by Krishnavedala.
Permission
(Reusing this file)
GNU head Permission is granted to copy, distribute and/or modify this document under the terms of the GNU Free Documentation License, Version 1.2 or any later version published by the Free Software Foundation; with no Invariant Sections, no Front-Cover Texts, and no Back-Cover Texts. A copy of the license is included in the section entitled GNU Free Documentation License.
w:en:Creative Commons
attribution share alike
This file is licensed under the Creative Commons Attribution-Share Alike 3.0 Unported license.
You are free:
  • to share – to copy, distribute and transmit the work
  • to remix – to adapt the work
Under the following conditions:
  • attribution – You must give appropriate credit, provide a link to the license, and indicate if changes were made. You may do so in any reasonable manner, but not in any way that suggests the licensor endorses you or your use.
  • share alike – If you remix, transform, or build upon the material, you must distribute your contributions under the same or compatible license as the original.
This licensing tag was added to this file as part of the GFDL licensing update.
Other versions Derivative works of this file:  Eicosanoid synthesis pl.svg, Eicosanoid_synthesis_arm.png
SVG development
InfoField
 
The SVG code is valid.
 
This vector image was created with LaTeX, converted to SVG using dvisvgm and manually edited using text editor.
Translate this file This SVG file contains embedded text that can be translated into your language, using any capable SVG editor, text editor or the SVG Translate tool. For more information see: About translating SVG files.
Source code
InfoField

LaTeX code

Source code
\documentclass[10pt,border=0pt,crop,multi=false,tikz,class=scrartcl]{standalone}
\usepackage[T1]{fontenc}
\usepackage{DejaVuSans}
\usepackage{amsmath}
\usetikzlibrary{positioning, calc}

\renewcommand*{\familydefault}{\sfdefault}
 
\begin{document}
\begin{tikzpicture}[
    >=latex,
    arrow/.style={->,thick},
    cat2/.style={color=blue,font=\footnotesize, minimum width=1.5cm},
    cat/.style={cat2, font=\itshape\footnotesize},
    every node/.style={minimum width=1cm, align=center}
]
\node (d1) {Diacylglycerol or phospholipid};
\node[below=1.5cm of d1,font=\large] (d2) {Arachidonic acid};
\node[right=3cm of d2] (d22) {HPETE (hydroperoxy-\\eicosatetraenoic acid)};
\node[below=2cm of d2,font=\large] (d3) {Prostaglandin H\({}_\text{2}\) (PGH\({}_\text {2}\))};
\node[below=1.25cm of d22] (d32) {Leukotriene A\(_\text 4\)};
\node[left=1.7cm of d32] (d33) {LTB\(_4\)};
\node[below=1.25cm of d32] (d42) {Leukotriene C\(_\text 4\)};
\node[below=1cm of d42] (d52) {Leukotriene D\(_\text 4\)};
\node[below=1cm of d52] (d62) {Leukotriene E\(_\text 4\)};
\node[below=4.5cm of d3,anchor=65] (d501) {Prostacyclin\\(PGI\({}_\text2\))};
\node[below right=4.5cm and -1.5cm of d3,anchor=155] (d502) {Thromboxane\\(TXA\({}_\text2\))};
\draw[arrow] (d1) -- 
    node[pos=.5,left,cat] {Phospho-\\lipase C} 
    node[pos=.5,right,cat] {Phospho-\\lipase A\({}_{\textit2}\)} 
    (d2);
\draw[arrow] (d2) -- 
    node[pos=.5,below,cat] {Lipooxygenase\\(FLAP, Alox5)} 
    (d22);
\draw[arrow] (d2) -- 
    node[pos=.5,left,cat,align=right] {PGH\({}_{\textit2}\) synthase\\ (cox--1 or cox--2 and\\ peroxidase)}
    (d3);
\draw [arrow] (d22) -- (d32);
\draw[arrow]
    (d32) ++(-1.75,.75) node (h2o) {H\(_\text 2\)O} 
    (h2o) to [out=-90,in=0] (d33)
    (d32) -- (d33)
    ;
\draw[arrow]
    (d32) -- node [pos=.5,above left=.15cm and .5cm] (glut1) {Glutathione}
    node[pos=.5,right,cat] {Glutathione-\\S-transferase}
    (d42)
    (glut1) to [out=0,in=90] (d42)
    ;
\draw[arrow]
    (d42) -- node [pos=.5,below left=.1cm and .75cm] (glut2) {Glutatmic acid}
    (d52)
    ;
\draw [arrow] (d42) to [out=-90,in=0] (glut2);
\draw [arrow] (d52) -- (d62);
\draw [arrow] (d3) to [out=180,in=90] node[pos=.5,above left,cat2] {PGD\\synthase} ++(-3.25,-.75) 
    node [anchor=north] {PGD\(_\text 2\)}
    ;
\draw [arrow] (d3.south) ++(-1.75,0) 
    -- node[pos=.5,right,cat2,align=left] {PGE\\synthase} 
    ++(0,-2) node[anchor=north] (d41) {PGE\(_\text2\)};
\draw [arrow] (d41) to [out=-90,in=0] ++(-1,-1) node [anchor=east] {PGF\(_\text2\)};
\draw [arrow] (d3) -- node[pos=.5,rotate=90,cat2,below] {Prostacyclin synthase}
    (d501.north -| d3);
\draw [arrow] (d3.south -| d502) -- node[pos=.5,rotate=90,cat2,below] {Thromboxane synthase}
    (d502);
\draw [arrow] (d501) -- node[pos=.5,below,cat2] {endothelium}
    ++(-2.8,0)
    node[anchor=east] {6-keto-\\PGF\(_{\text1\mathrm\alpha}\)};
\draw [arrow] (d502) -- node[pos=.5,below,cat2] {platelets}
    ++(2.8,0)
    node[anchor=west] {Thromboxane\\(TXA\(_\text2\))};
\end{tikzpicture}
\end{document}

Captions

Add a one-line explanation of what this file represents

Items portrayed in this file

depicts

30 January 2007

File history

Click on a date/time to view the file as it appeared at that time.

Date/TimeDimensionsUserComment
current10:10, 13 May 2020512 × 403 (9 KB)Krishnavedalafixed margin on the right hand side

The following page uses this file:

Metadata