File:Geothermal.Electricity.NZ.Wairakei.png

Size of this preview: 800 × 117 pixels. Other resolutions: 320 × 47 pixels | 2,872 × 419 pixels.
Original file (2,872 × 419 pixels, file size: 216 KB, MIME type: image/png)
| This is a file from the Wikimedia Commons. The description on its description page there is shown below.
|
Summary
| Description |
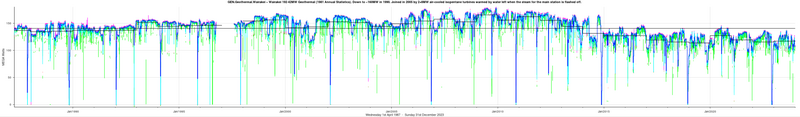
English: Generation at the Wairakei geothermal power station, half-hourly figures grouped daily and plotted as magenta (max-upper quartile), green (min-lower quartile), red (median), pale blue (daily average) stepwise dark blue (weekly average), black step (annual averages), black line (overall average). |
| Date | 23 August 2010 (original upload date) |
| Source |
Data via the N.Z. Electricity Commission collection and Gnash, plotted via MatLab
|
| Author | NickyMcLean at en.wikipedia |
Licensing
NickyMcLean at English Wikipedia, the copyright holder of this work, hereby publishes it under the following license:
This file is licensed under the Creative Commons Attribution-Share Alike 3.0 Unported license.
Attribution: NickyMcLean at English Wikipedia
- You are free:
- to share – to copy, distribute and transmit the work
- to remix – to adapt the work
- Under the following conditions:
- attribution – You must give appropriate credit, provide a link to the license, and indicate if changes were made. You may do so in any reasonable manner, but not in any way that suggests the licensor endorses you or your use.
- share alike – If you remix, transform, or build upon the material, you must distribute your contributions under the same or compatible license as the original.
Original upload log
The original description page was here. All following user names refer to en.wikipedia.
Upload date | User | Bytes | Dimensions | Comment
- 2010-08-23 23:00 (UTC) | NickyMcLean | 18659 (bytes) | 1195×279 | {{Information|Source=Data via the N.Z. Electricity Commission collection and Gnash, plotted via MatLab|Author=NickyMcLean|Description = Generation at the Wairakei geothermal power station, half-hourly figures grouped daily and plotted as magenta (max-uppe
File history
Click on a date/time to view the file as it appeared at that time.
| Date/Time | Dimensions | User | Comment | |
|---|---|---|---|---|
| current | 04:05, 19 January 2024 | 2,872 × 419 (216 KB) | NickyMcLean | More data (via Gnash, available through https://www.dropbox.com/scl/fo/ybht00jahx8mzto4jrzkk/h?rlkey=jyosqn7mp34vqyf40s4triub6&dl=0), and plotted via Octave and a screengrab because print -dpng (or svg) damages both the on-screen image and the resulting .png file. |
File usage
The following page uses this file: