File:HATS Nitrous Oxide concentration.png
HATS_Nitrous_Oxide_concentration.png (695 × 406 pixels, file size: 57 KB, MIME type: image/png)
| This is a file from the Wikimedia Commons. The description on its description page there is shown below.
|
Summary
| Description |
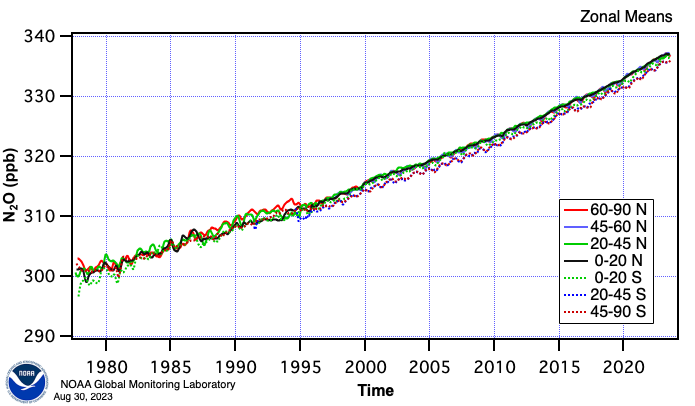
English: Graph shows the concentration of nitrous oxide ( N2O) in earth's atmosphere versus time and latitude. X-axis data interval is monthly. Y-axis concentration is parts per billion. Atmospheric samples were gathered within evacuated flasks from 8-12 ground stations distributed over the northern (positive latitudes) and southern hemispheres, then sealed and transported to Boulder Colorado for analysis. Most emissions originate at northern latitudes, and are mixed through the troposphere of both hemispheres after about 1-2 years. Data sampling and analysis by: |
| Date | |
| Source | https://www.esrl.noaa.gov/gmd/hats/combined/N2O.html |
| Author | NOAA |
Licensing
This image is in the public domain because it contains materials that originally came from the U.S. National Oceanic and Atmospheric Administration, taken or made as part of an employee's official duties.
|
File history
Click on a date/time to view the file as it appeared at that time.
| Date/Time | Dimensions | User | Comment | |
|---|---|---|---|---|
| current | 18:50, 8 February 2024 | 695 × 406 (57 KB) | Bikesrcool | update February 2024 |
File usage
The following page uses this file: