File:Historical Average SAT Scores (Vector).svg

Original file (SVG file, nominally 512 × 341 pixels, file size: 79 KB)
| This is a file from the Wikimedia Commons. The description on its description page there is shown below.
|
.svg)
Summary
| Description |
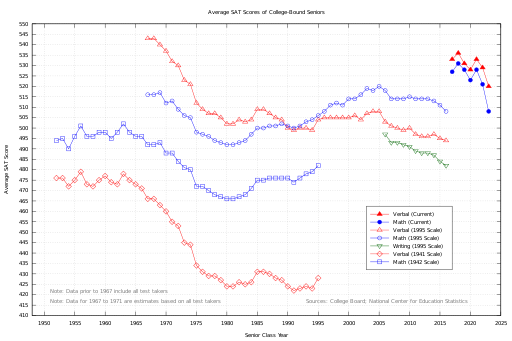
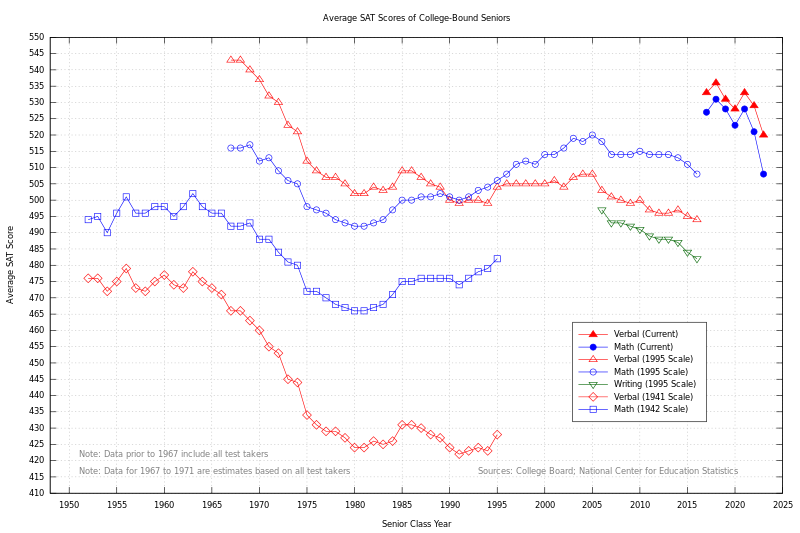
English: A chart of the SAT scores of high school seniors from 1952 to the present. |
| Date | |
| Source | Own work |
| Author | Erik Jacobsen ( erikthered.com ) |
Average scores are shown on the original (1941/1942) SAT scale through senior class year 1995. Average scores from 1967 to the present are also shown on the current SAT scale, as follows. Data for 1967 to 1986 were converted to the re-centered scale by using a formula applied to the original mean and standard deviation. For 1987 to 1995, individual student scores were converted to the re-centered scale and then the mean was recomputed. For 1996 to 1999, nearly all students received scores on the re-centered scale; any score on the original scale was converted to the re-centered scale prior to recomputing the mean. From 2000 on, all scores have been reported on the re-centered scale.
Data prior to class year 1967 include all tests taken by all participants and may include students other than seniors. Data for class years 1967 through 1971 are estimates derived from the test scores of all participants. Data for class years 1972 through 2006 include seniors who took the SAT any time during their high school years through March of their senior year. Data for class years 2007 to 2015 include seniors who took the SAT any time during their high school years through June of their senior year. Data for class year 2016 includes seniors who took the SAT any time during their high school years through January, 2016. If a student took a test more than once, the most recent score was used. Possible scores on each part of the SAT range from 200 to 800. The critical reading section was formerly known as the verbal section.
SOURCES: College Entrance Examination Board, College-Bound Seniors: Total Group Profile [National] Report; College Board, Report on Declining SAT Scores (1977); National Center for Education Statistics (nces.ed.gov)
Note: there may be a bug in the Wikimedia SVG conversion library which is incorrectly previewing this file. The SVG file itself should correctly render on your device.
Licensing
- You are free:
- to share – to copy, distribute and transmit the work
- to remix – to adapt the work
- Under the following conditions:
- attribution – You must give appropriate credit, provide a link to the license, and indicate if changes were made. You may do so in any reasonable manner, but not in any way that suggests the licensor endorses you or your use.
- share alike – If you remix, transform, or build upon the material, you must distribute your contributions under the same or compatible license as the original.
File history
Click on a date/time to view the file as it appeared at that time.
| Date/Time | Dimensions | User | Comment | |
|---|---|---|---|---|
| current | 05:42, 25 October 2023 | 512 × 341 (79 KB) | Erjwiki | updated for class of 2023 data |
File usage
The following page uses this file:
.svg)