File:LafferCurve.svg

Size of this PNG preview of this SVG file: 512 × 345 pixels. Other resolutions: 320 × 216 pixels | 640 × 431 pixels | 800 × 539 pixels | 1,024 × 690 pixels | 1,280 × 863 pixels.
Original file (SVG file, nominally 512 × 345 pixels, file size: 25 KB)
| This is a file from the Wikimedia Commons. The description on its description page there is shown below.
|
Summary
| Description |
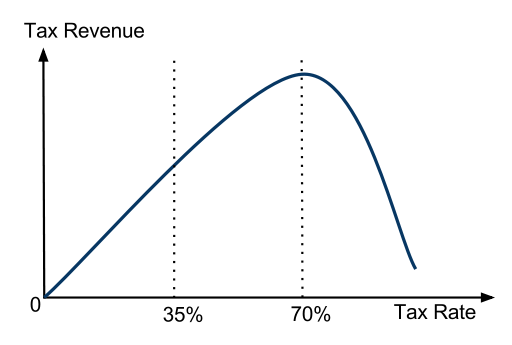
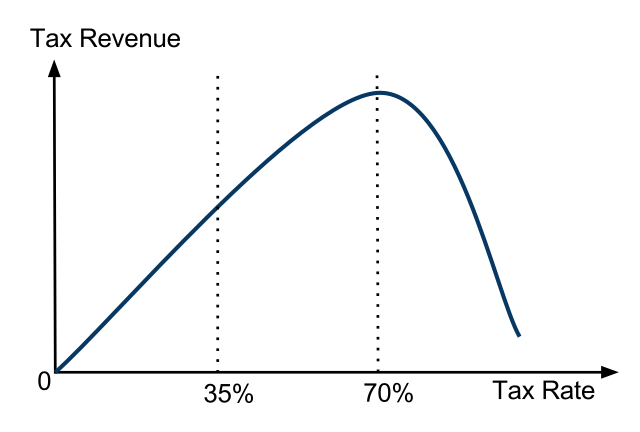
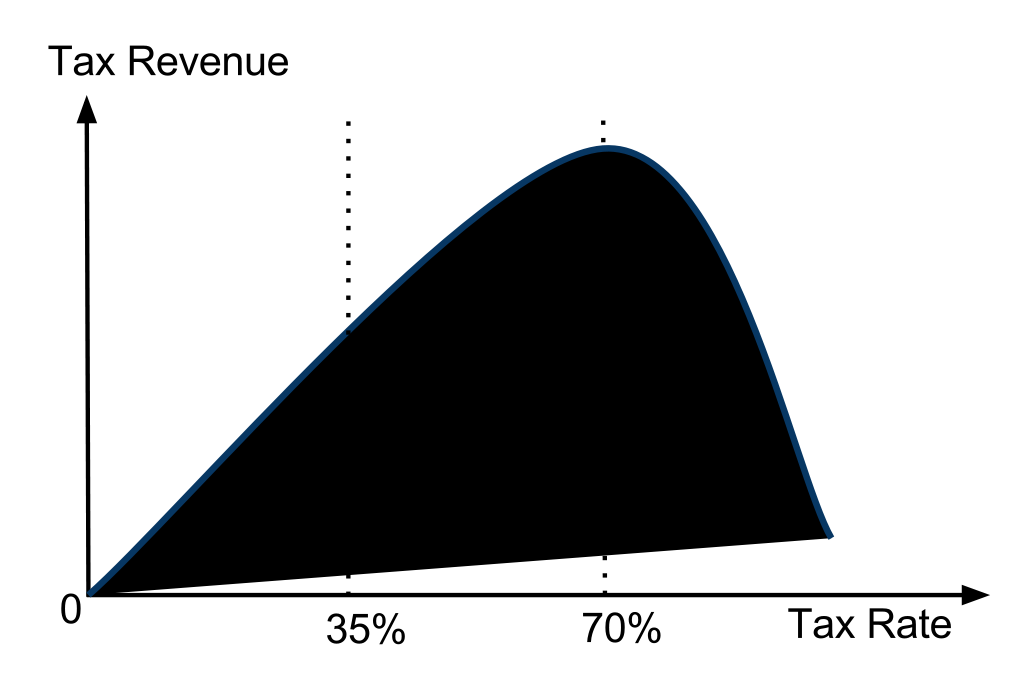
English: A non-symmetric Laffer Curve with a maximum revenue point at around a 70% tax rate. This graph is based on the article "How Far Are We From The Slippery Slope? The Laffer Curve Revisited" by Mathias Trabandt and Harald Uhlig, NBER Working Paper No. 15343, September 2009. Specifically, it mimics the curve found in Figure 2 of that paper. Their research estimated Laffer Curve maximum revenue points to be between 60% to 80% tax rates. |
| Date | |
| Source | Own work |
| Author | Lawrencekhoo |
Licensing
I, the copyright holder of this work, hereby publish it under the following license:
| This file is made available under the Creative Commons CC0 1.0 Universal Public Domain Dedication. | |
| The person who associated a work with this deed has dedicated the work to the public domain by waiving all of their rights to the work worldwide under copyright law, including all related and neighboring rights, to the extent allowed by law. You can copy, modify, distribute and perform the work, even for commercial purposes, all without asking permission.
|
File history
Click on a date/time to view the file as it appeared at that time.
| Date/Time | Dimensions | User | Comment | |
|---|---|---|---|---|
| current | 00:24, 29 March 2011 | 512 × 345 (25 KB) | Lawrencekhoo | Trim white space around main graph |
File usage
The following page uses this file: