File:Plot arctic sea ice volume.svg
Original file(SVG file, nominally 864 × 576 pixels, file size: 43 KB)

Commons-logo.svg This is a file from the Wikimedia Commons. The description on its description page there is shown below.
Commons is a freely licensed media file repository. You can help.

Summary

Description
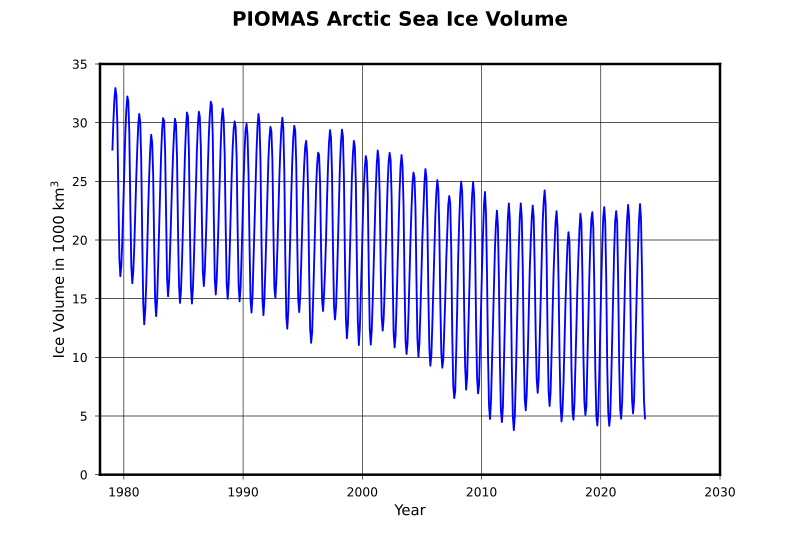
English: Plot of estimated development of arctic sea ice volume between 1979 and now. Blue curve are data as determined by the numerical model PIOMAS. An error margin of +- 1.35 10³ km³ is given for october single values (minima) as orientation.


Deutsch: Zeitverlauf der Schätzung des Volumens des arktischen Meereseises zwischen 1979 und 2010. Die blaue Kurve wurde durch das numerische Modell PIOMAS berechnet. Als Fehler für Einzelwerte wird für Oktoberwerte (Minima) +- 1.35 10³ km³ als Orientierung angegeben.
Date
Source

{{Volume time series and uncertainties: Schweiger, A., R. Lindsay, J. Zhang, M. Steele, H. Stern, Uncertainty in modeled arctic sea ice volume, J. Geophys. Res., doi:10.1029/2011JC007084, 2011, Plot: own work, done with Python, Numpy, Matplotlib}},

based on published data of Polar Science Center, University of Washington,

http://psc.apl.washington.edu/research/projects/arctic-sea-ice-volume-anomaly/data/
Author Dominiklenne

Licensing

Public domain I, the copyright holder of this work, release this work into the public domain. This applies worldwide.
In some countries this may not be legally possible; if so:
I grant anyone the right to use this work for any purpose, without any conditions, unless such conditions are required by law.

Captions

Add a one-line explanation of what this file represents

Items portrayed in this file

depicts

3 March 2013

image/svg+xml

File history

Click on a date/time to view the file as it appeared at that time.

Date/TimeDimensionsUserComment
current11:52, 7 November 2024864 × 576 (43 KB)Dominiklenneupdate until october 2024

The following 2 pages use this file:

Metadata