File:Steve Waugh Graph.png

Size of this preview: 800 × 409 pixels. Other resolutions: 320 × 163 pixels | 640 × 327 pixels | 963 × 492 pixels.
Original file (963 × 492 pixels, file size: 8 KB, MIME type: image/png)
| This is a file from the Wikimedia Commons. The description on its description page there is shown below.
|
| Description |
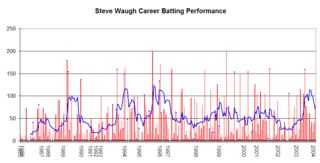
English: This graph details the Test Match performance of Steve Waugh. It was created by Raven4x4x. The red bars indicate the player's test match innings, while the blue line shows the average of the ten most recent innings at that point. Note that this average cannot be calculated for the first nine innings. The blue dots indicate innings in which Waugh finished not-out.
This graph was generated with Microsoft Excel 2002, using data from Cricinfo and Howstat.com.au. |
||
| Date | 30 October 2005, 07:10 (original upload date) | ||
| Source | Originally from en.wikipedia; description page is/was here. | ||
| Author | Raven4x4x at English Wikipedia | ||
| Permission (Reusing this file) |
|
Original upload log
(All user names refer to en.wikipedia)
- 07:10, 30 October 2005 Raven4x4x . 963×492 (7,950 bytes) (This graph details the Test Match performance of Steve Waugh. The red bars indicate the player's test match innings, while the blue line shows the average of the ten most recent innings at that point. Note that thi)
File history
Click on a date/time to view the file as it appeared at that time.
| Date/Time | Dimensions | User | Comment | |
|---|---|---|---|---|
| current | 11:48, 25 June 2007 | 963 × 492 (8 KB) | Responsible? | {{Information |Description={{en|This graph details the Test Match performance of Steve Waugh. It was created by Raven4x4x. The red bars indicate the player's test match innings, while the blue line shows the average of the ten most recent innings at that |
File usage
The following page uses this file: