File:Timeline of daily COVID-19 vaccine doses administered in the US.svg

Size of this PNG preview of this SVG file: 800 × 565 pixels. Other resolutions: 320 × 226 pixels | 640 × 452 pixels | 1,024 × 723 pixels | 1,280 × 904 pixels | 850 × 600 pixels.
Original file (SVG file, nominally 850 × 600 pixels, file size: 57 KB)
| This is a file from the Wikimedia Commons. The description on its description page there is shown below.
|
Summary
| Description |
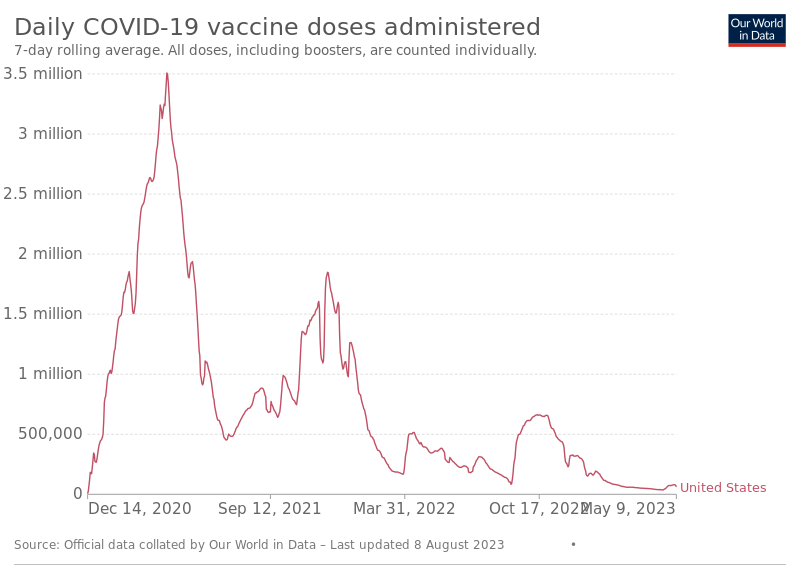
English: Timeline of daily COVID-19 vaccine doses administered in the US. Rolling 7-day average. See the date on the right side of the timeline below the graph. |
| Date | 20 June 2021 is the date of the first upload to the Commons. See the file history below for the most recent upload date. Please upload new versions. Use the upload link at the end of the file history list. |
| Source | https://ourworldindata.org/grapher/daily-covid-19-vaccination-doses?tab=chart&country=~USA Click on the download tab, and then the SVG link to get the SVG file. The table tab has a table of the data by date. The sources tab says the data is from the COVID-19 Data Repository by the Center for Systems Science and Engineering (CSSE) at Johns Hopkins University. The graph on the chart tab at the source is interactive and provides more detail. For example, run your cursor over the graph to see the date and the number vaccinated that day. The actual number may be higher or lower since a rolling 7-day average is used. |
| Author | Our World In Data. See Our World in Data. |
| SVG development | This W3C-invalid chart was created with an unknown SVG tool. |
Licensing
This file is licensed under the Creative Commons Attribution 4.0 International license.
- You are free:
- to share – to copy, distribute and transmit the work
- to remix – to adapt the work
- Under the following conditions:
- attribution – You must give appropriate credit, provide a link to the license, and indicate if changes were made. You may do so in any reasonable manner, but not in any way that suggests the licensor endorses you or your use.
File history
Click on a date/time to view the file as it appeared at that time.
| Date/Time | Dimensions | User | Comment | |
|---|---|---|---|---|
| current | 11:52, 8 August 2023 | 850 × 600 (57 KB) | Timeshifter | Latest |
File usage
The following page uses this file: