File:Weimar Einwohner.svg

Size of this PNG preview of this SVG file: 800 × 400 pixels. Other resolutions: 320 × 160 pixels | 640 × 320 pixels | 1,024 × 512 pixels | 1,280 × 640 pixels.
Original file (SVG file, nominally 800 × 400 pixels, file size: 34 KB)
| This is a file from the Wikimedia Commons. The description on its description page there is shown below.
|
Summary
| Description | |
| Date | |
| Source | |
| Author | Stefan |
Licensing

|
The copyright holder of this work allows anyone to use it for any purpose including unrestricted redistribution, commercial use, and modification.
Usage notes:
|
Original upload log
Transferred from de.wikipedia to Commons by Torsch.
The original description page was here. All following user names refer to de.wikipedia.
Upload date | User | Bytes | Dimensions | Comment
- 2012-03-23 15:33:35 | StefanPohl | 13702 | 800×600 | {{Information |Beschreibung = Einwohnerentwicklung [[Weimar]] |Quelle = selbst mit [[gnuplot]] mit Daten aus [[Weimar]] |Urheber = ~~~ |Datum = 23.03.2012 |Genehmigung = |Andere Versionen = |Anmerkungen = …
Gnuplot script to generate this plot
#!/usr/bin/gnuplot
# gnuplot
# Allgemeines zu den Eingabedaten
set timefmt "%d.%m.%Y" # Zeitangaben in TT.MM.YYYY
set datafile separator ";" # Spaltenseparator
# Allgemeines zur Ausgabe
unset key
set style data lines
set style fill transparent solid 0.4
set grid
# Bereiche/Format/etc X-Achse
set xdata time
set xlabel 'Jahr'
set xrange ['30.06.1779':'31.12.2015']
set xtics '01.01.1750', 60 * 60 * 24 * 365.25 * 25
# xtics in Sekunden
# der Beginn der X-Einteilung kann außerhalb xrange
# liegen
set mxtics 5
set format x '%Y' # Beschriftungsformat JJJJ
# Bereiche/Format/etc Y-Achse
set ylabel 'Einwohnerzahl'
set yrange [0:]
set ytics 5000
set decimalsign locale "de_DE.utf8"
set decimal locale "de_DE.utf8"
set format y "%'.0f" # Ausgabeformat
set mytics 5
# Ausgabeformat: Wir erzeugen SVG
# Die Ausgabedaten leiten wir in eine Pipe und sind so bei Namen der
# Ausgabedatei flexibel (Aufruf: Progname.plt > Ausgabe-svg)
set term svg size 800,400 font "Arial,14"
# keine "set output '<Dateiname>'" Angabe
# Erzeugen der Ausgabe
plot '-' using 1:($2) with filledcurves below x1 lt rgb 'dark-blue' lw 2
# Quelle:
# https://de.wikipedia.org/wiki/Weimar#Einwohnerentwicklung
#
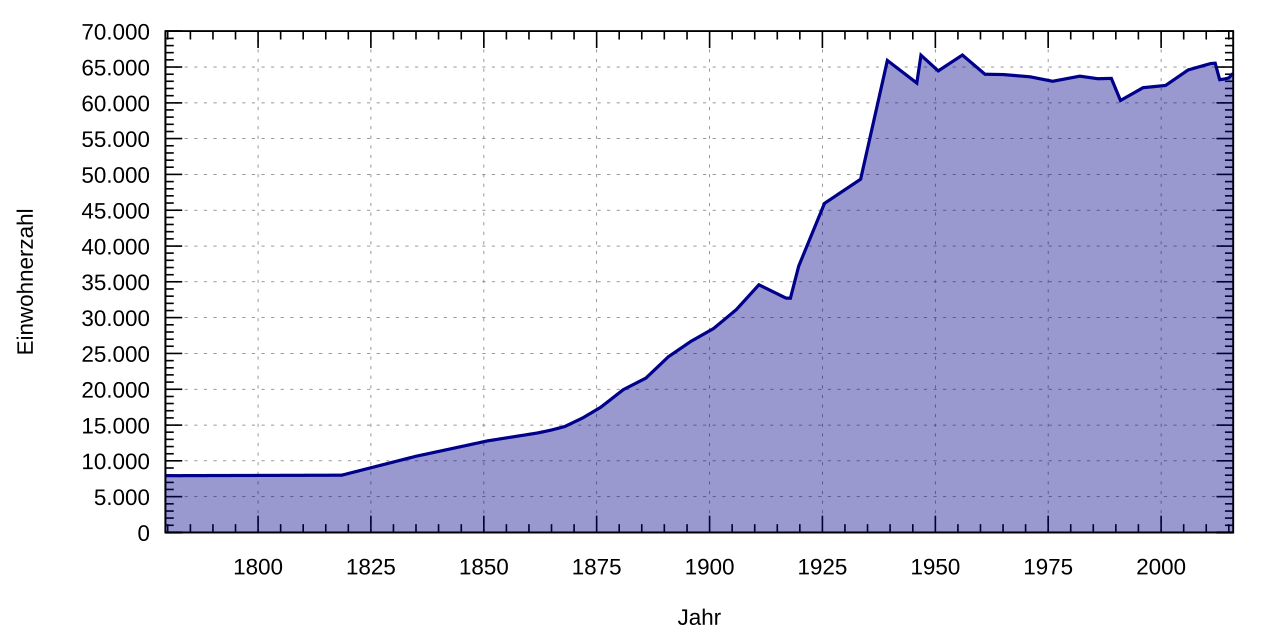
30.06.779;6041
30.06.1818;8000
#
01.12.1834;10638
01.12.1850;12798
03.12.1861;13887
03.12.1864;14300
03.12.1867;14800
01.12.1871;16000
01.12.1875;17500
01.12.1880;19944
01.12.1885;21565
01.12.1890;24546
02.12.1895;26700
01.12.1900;28479
01.12.1905;31117
#
01.12.1910;34582
01.12.1916;32733
05.12.1917;32717
08.10.1919;37200
16.06.1925;45957
16.06.1933;49327
17.05.1939;65916
01.12.1945;62768
29.10.1946;66659
31.08.1950;64452
31.12.1955;66675
31.12.1960;63996
31.12.1964;63943
01.01.1971;63634
31.12.1975;63004
#
31.12.1981;63725
31.12.1985;63373
31.12.1988;63412
31.12.1990;60326
31.12.1995;62122
31.12.2000;62425
31.12.2005;64594
31.12.2010;65479
31.12.2011;65542
31.12.2012;63236
31.12.2013;63315
31.12.2014;63477
31.12.2015;64131
e
File history
Click on a date/time to view the file as it appeared at that time.
| Date/Time | Dimensions | User | Comment | |
|---|---|---|---|---|
| current | 03:44, 27 August 2017 | 800 × 400 (34 KB) | Summer ... hier! | Grafik nach erneuterten gnuplot Code (siehe Edit vor wenigen Min.) aktualisiert; Aktuellere Daten (etwa vier Jahre); Beschriftung X-Achse auf Runde werte gesetzt; Y-Achse mit Dezimalpunkt |
File usage
The following page uses this file: