2019 Danish general election
General elections were held in Denmark on 5 June 2019 to elect all 179 members of the Folketing;[1] 175 in Denmark proper, two in the Faroe Islands and two in Greenland. The elections took place ten days after the European Parliament elections.[2]
Party leaders
Lawyer
Rasmus Paludan
(Hard Line)
from North ZealandCivil servant
Isabella Arendt
(Christian Democrats)
from Southern DenmarkBusinessman
Klaus Riskær Pedersen
(Klaus Riskær Pedersen Party)
from Capital Region
Opinion polling

The 30-day average trendline of the Danish opinion polls towards the general election in 2019. Each line corresponds to a political party. The date range for these opinion polls are from June 2015, when the previous parliamentary election occurred, to May 2019. The 15-day average as of 4 June is also shown.
Results
| Popular vote in Denmark | ||||
|---|---|---|---|---|
| A | 25.9% | |||
| V | <div style="background:Lua error in package.lua at line 80: module 'Module:Political party/V' not found.; width:234px; overflow:hidden"> | 23.4% | ||
| O | 8.7% | |||
| B | 8.6% | |||
| F | 7.7% | |||
| Ø | 6.9% | |||
| C | 6.6% | |||
| Å | <div style="background:Lua error in package.lua at line 80: module 'Module:Political party/T' not found.; width:30px; overflow:hidden"> | 3.0% | ||
| D | <div style="background:Lua error in package.lua at line 80: module 'Module:Political party/T' not found.; width:24px; overflow:hidden"> | 2.4% | ||
| I | 2.3% | |||
| P | <div style="background:Lua error in package.lua at line 80: module 'Module:Political party/H' not found.; width:18px; overflow:hidden"> | 1.8% | ||
| K | 1.7% | |||
| E | <div style="background:Lua error in package.lua at line 80: module 'Module:Political party/K' not found.; width:8px; overflow:hidden"> | 0.8% | ||
| Others | 0.1% | |||

| ||||||
|---|---|---|---|---|---|---|
| Party | Votes | % | Seats | +/– | ||
| Denmark proper | ||||||
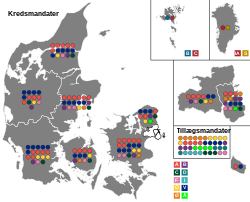
| Social Democrats (A) | 914,882 | 25.9 | 48 | +1 | ||
| Venstre (V) | 826,161 | 23.4 | 43 | +9 | ||
| Danish People's Party (O) | 308,513 | 8.7 | 16 | –21 | ||
| Danish Social Liberal Party (B) | 304,714 | 8.6 | 16 | +8 | ||
| Socialist People's Party (F) | 272,304 | 7.7 | 14 | +7 | ||
| Red–Green Alliance (Ø) | 245,100 | 6.9 | 13 | –1 | ||
| Conservative People's Party (C) | 233,865 | 6.6 | 12 | +6 | ||
| The Alternative (Å) | 104,278 | 3.0 | 5 | –4 | ||
| The New Right (D) | 83,201 | 2.4 | 4 | New | ||
| Liberal Alliance (I) | 82,270 | 2.3 | 4 | –9 | ||
| Hard Line (P) | 63,114 | 1.8 | 0 | New | ||
| Christian Democrats (K) | 60,944 | 1.7 | 0 | 0 | ||
| Klaus Riskær Pedersen (E) | 29,600 | 0.8 | 0 | New | ||
| Independents | 2,774 | 0.1 | 0 | 0 | ||
| Invalid/blank votes | 37,801 | – | – | – | ||
| Total | 3,569,521 | 100 | 175 | 0 | ||
| Registered voters/turnout | 4,219,537 | 84.6 | – | – | ||
| Faroe Islands | ||||||
| Union Party | 7,349 | 28.3 | 1 | +1 | ||
| Social Democratic Party | 6,630 | 25.5 | 1 | 0 | ||
| People's Party | 6,181 | 23.8 | 0 | 0 | ||
| Republic | 4,830 | 18.6 | 0 | –1 | ||
| Progress | 639 | 2.5 | 0 | 0 | ||
| Self-Government Party | 333 | 1.3 | 0 | 0 | ||
| Invalid/blank votes | 244 | – | – | – | ||
| Total | 26,206 | 100 | 2 | 0 | ||
| Registered voters/turnout | 37,264 | 70.3 | – | – | ||
| Greenland | ||||||
| Inuit Ataqatigiit | 6,881 | 33.4 | 1 | 0 | ||
| Siumut | 6,058 | 29.4 | 1 | 0 | ||
| Democrats | 2,262 | 11.0 | 0 | 0 | ||
| Nunatta Qitornai | 1,616 | 7.8 | 0 | New | ||
| Partii Naleraq | 1,565 | 7.6 | 0 | 0 | ||
| Atassut | 1,099 | 5.3 | 0 | 0 | ||
| Cooperation Party | 520 | 2.5 | 0 | New | ||
| Invalid/blank votes | 614 | – | – | – | ||
| Total | 20,615 | 100 | 2 | 0 | ||
| Registered voters/turnout | 41,344 | 49.9 | – | – | ||
| Source: Statistics Denmark, Kringvarp Føroya, Qinersineq | ||||||
2019 Danish General Election Media
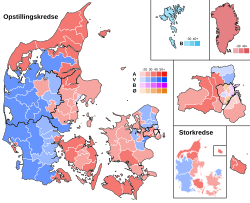
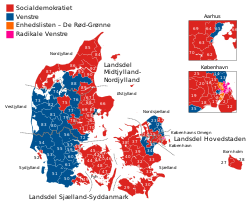
Largest party in each nomination district.
Notes
- ↑ Name is bold because she won the election
References
- ↑ Denmark's prime minister calls election to be held on June 5 Reuters, 7 May 2019
- ↑ Lindqvist, Andreas (7 May 2019). "EP-spidskandidater uenige: Er Folketingsvalgkamp godt eller skidt for EU-debatten?" (in Danish). DR. https://www.dr.dk/nyheder/politik/ep-valg/ep-spidskandidater-uenige-er-folketingsvalgkamp-godt-eller-skidt-eu-debatten. Retrieved 7 May 2019.
Other websites
- How the night unfolded with no clear winner at The Guardian


