File:Bow echo diagram.svg
Original file(SVG file, nominally 542 × 294 pixels, file size: 204 KB)

Commons-logo.svg This is a file from the Wikimedia Commons. The description on its description page there is shown below.
Commons is a freely licensed media file repository. You can help.

Summary

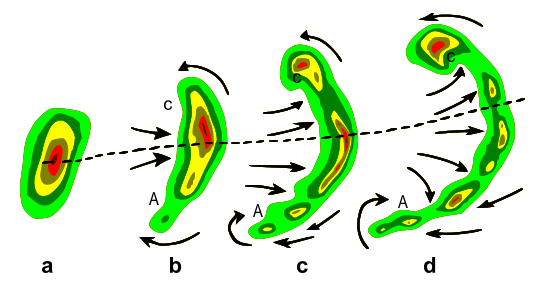
Description Typical evolution of a thunderstorm radar echo (a) into a bow echo (b, c) and into a comma echo (d). Dashed line indicates axis of greatest potential for downbursts. Arrows indicate wind flow relative to the storm. Note regions of cyclonic rotation (C) and anticyclonic rotation (A); both regions, especially C, are capable of supporting tornado development in some cases.
Date Plain GIF version was uploaded to English Wikipedia as Bowecho1.gif on 9 Apr 2007 (UTC) by Utahweather.
Source Vectorization of http://www.srh.noaa.gov/oun/severewx/figure1.php
Author National Weather Service
Permission
(Reusing this file)
Public domain
 
This W3C-unspecified vector image was created with Inkscape .

Licensing

Public domain
This image is in the public domain because it contains materials that originally came from the U.S. National Oceanic and Atmospheric Administration, taken or made as part of an employee's official duties.

العربية  čeština  Deutsch  Zazaki  English  español  eesti  suomi  français  hrvatski  magyar  italiano  日本語  한국어  македонски  മലയാളം  Plattdüütsch  Nederlands  polski  português  română  русский  sicilianu  slovenščina  Türkçe  Tiếng Việt  简体中文  繁體中文  +/−

Public domain
This work is based on a work in the public domain. It has been digitally enhanced and/or modified. This derivative work has been (or is hereby) released into the public domain by its author, Remember the dot. This applies worldwide.

In some countries this may not be legally possible; if so:

Remember the dot grants anyone the right to use this work for any purpose, without any conditions, unless such conditions are required by law.

Captions

Add a one-line explanation of what this file represents

Items portrayed in this file

depicts

image/svg+xml

10c818b83f6de40446cc148163482249fadc5698

209,396 byte

294 pixel

542 pixel

File history

Click on a date/time to view the file as it appeared at that time.

Date/TimeDimensionsUserComment
current22:03, 10 April 2007542 × 294 (204 KB)Remember the dot{{Information |Description=Typical evolution of a thunderstorm radar echo (a) into a bow echo (b, c) and into a comma echo (d). Dashed line indicates axis of greatest potential for downbursts. Arrows indicate wind flow relative to the storm. Note regions

The following 2 pages use this file: