File:SampleBiasCoefficient.png
SampleBiasCoefficient.png (360 × 372 pixels, file size: 24 KB, MIME type: image/png)
| This is a file from the Wikimedia Commons. The description on its description page there is shown below.
|
Summary
| Description |
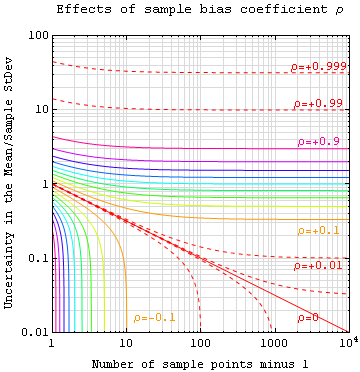
An estimate of expected error in the (sample estimate of the population) mean of variable A sampled at N locations in a parameter space x, can be expressed in terms of sample bias coefficient ρ defined as the average auto-correlation coefficient ρAA[Δx] over all sample point pairs. This generalized error in the mean is the square root of: sample variance (treated as a population) times (1+(N-1)ρ)/((N-1)(1-ρ)). The ρ=0 line (of log-log slope -½) is the more familiar standard error in the mean for samples that are uncorrelated. Example: For a 3D fragment of size D taken from a collection of differing and randomly-distributed but homogeneous grains of size d, sample bias may be approximated by ρ ≈ 1-(D/d)+(2/7)(D/d)2 when D≤d and ρ ≈ (2/7)(d/D)5-(d/D)4+(d/D)3 when D>d. Hence an equidimensional fragment about 4.2 times the grain size will have ρ~0.01 and leave you with uncertainty in the population mean of no less than about 10% of the sample standard deviation, regardless of how many points within that fragment are sampled. Notes: The "Sample StDev" mentioned in the vertical axis label is the square root of sample variance (treated as a population), rather than the ρ=0 sample-based estimate of population standard deviation which differs from the former by a factor of Sqrt[N/(N-1)]. The unbiased nature of this estimate is shown valid for arbitrary samples in Appendix 5 of P. Fraundorf (1980) "Microcharacterization of interplanetary dust collected in the earth's stratosphere" (Ph.D. Dissertation in Physics, Washington University, Saint Louis MO). |
| Date | |
| Source | Own work |
| Author | P. Fraundorf |
Licensing
- You are free:
- to share – to copy, distribute and transmit the work
- to remix – to adapt the work
- Under the following conditions:
- attribution – You must give appropriate credit, provide a link to the license, and indicate if changes were made. You may do so in any reasonable manner, but not in any way that suggests the licensor endorses you or your use.
- share alike – If you remix, transform, or build upon the material, you must distribute your contributions under the same or compatible license as the original.

|
Permission is granted to copy, distribute and/or modify this document under the terms of the GNU Free Documentation License, Version 1.2 or any later version published by the Free Software Foundation; with no Invariant Sections, no Front-Cover Texts, and no Back-Cover Texts. A copy of the license is included in the section entitled GNU Free Documentation License. |

|
This graph image could be re-created using vector graphics as an SVG file. This has several advantages; see Commons:Media for cleanup for more information. If an SVG form of this image is available, please upload it and afterwards replace this template with
{{vector version available|new image name}}.
It is recommended to name the SVG file “SampleBiasCoefficient.svg”—then the template Vector version available (or Vva) does not need the new image name parameter. |
File history
Click on a date/time to view the file as it appeared at that time.
| Date/Time | Dimensions | User | Comment | |
|---|---|---|---|---|
| current | 07:05, 13 July 2008 | 360 × 372 (24 KB) | Unitsphere | {{Information |Description= |Source= |Date= |Author= |Permission= |other_versions= }} |
File usage
The following page uses this file: