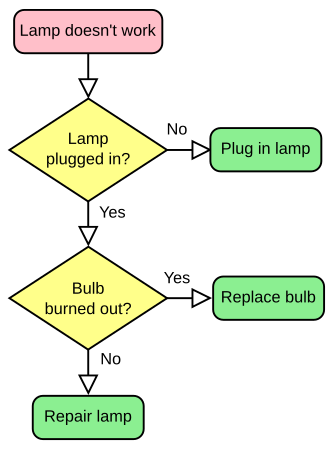
Flow chart
A flow chart, also known as a flowchart, is a type of diagram, made of boxes and arrows. It can be used to show:
- An algorithm, a step-by-step list of directions that need to be followed to solve a problem
- A process, a series of stages in time where the last stage is the product, result or goal.
- The planned stages of a project.
The flow chart uses boxes, arrows and other elements:
Flowchart building blocks
Common Shapes
The following table shows some of the most common shapes used in flowcharts. Generally, flowcharts are read from top to bottom and left to right. Reading flowcharts can also be called "flowing".
| Shape | Name | Description |
|---|---|---|
| Flow Line | A Flow Line is an arrow that shows the direction which the flowchart will flow. The line in the arrow can be dotted or solid. If the line is dotted, it can be defined in the legend. | |

|
Terminal | Terminals are represented as circles, ovals, stadiums or rounded (fillet) rectangles. They usually contain the word "Start" or "End", or another phrase that shows the start and the end, such as "submit inquiry" or "receive product". |

|
Process | A Process box is represented as a rectangle. This shape is used to show that something is performed. Examples: "Add 1 to X", "replace identified part", "save changes", etc.... |

|
Decision | A Decision box is represented as a diamond (rhombus) showing where a decision is necessary, commonly a Yes/No question or True/False test. Each arrow that flows out of a Decision box usually should show "Yes/No" or "True/False" |

|
Input/Output | An Input/Output box is represented as a parallelogram. This box involves receiving data and displaying processed data. The Input/Output box can only move from input to output and cannot be done the other way round. Examples: Get X from the user; display X. |

|
Annotation | Annotations represent comments or remarks about the flowchart. Annotations have no effect on what would happen to the flowchart. Sometimes, the shape consists of a box with dashed (or dotted) lines. |

|
Predefined Process | Predefined Process boxes are represented as rectangles with double-struck vertical edges. These boxes are used to show complex processing steps which may be detailed in a separate flowchart. Example: PROCESS-FILES. |

|
Preparation | Preparation boxes are represented as a hexagon. These may also be called initialization. It shows operations which have no effect other than preparing a value for a subsequent conditional or decision step. Alternatively, this shape is used to replace the Decision Shape in the case of conditional looping. |

|
On-Page Connector | An On-Page Connector is generally shown as a circle, and is used to show more of the flowchart in a certain area of the page. |

|
Off-Page Connector | An Off-Page Connecter is generally represented as a home plate-shaped pentagon. It works similarly to the on-page connector except it allows for placing a connector that connects to another page. |
Software
There are many different types of software that deal with making flowcharts. Some types of software allow users to design flowcharts that can be used to help them design a program easier. Other applications can also create programs based on the flowchart that the user designed. Some software that deal with making flowcharts include diagrams.net, Google Drawings, LibreOffice Draw, Microsoft Visio, yEd, and Inkscape.
Flow Chart Media
IBM flowcharting template
Related pages
| Wikimedia Commons has media related to Lua error in Module:Commons_link at line 62: attempt to index field 'wikibase' (a nil value).. |


