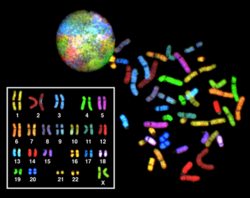
Karyotype
A karyotype is the number and appearance of chromosomes in the nucleus of a eukaryote cell.[1][2][3] The term is also used of the complete set of chromosomes in a species, or an individual organism. It describes the number of chromosomes, and what they look like under a light microscope. Attention is paid to their length, the position of the centromeres, any differences between the sex chromosomes, and any other physical characteristics.[4] The preparation and study of karyotypes is part of cytogenetics (cytology and genetics).
The basic number of chromosomes in the somatic (body) cells of an individual or a species is called the somatic number and is designated 2n. Thus, in humans 2n = 46. In the sex cells the chromosome number is n (humans: n = 23).[2]
So, in normal diploid organisms, chromosomes are present in two copies. There may, or may not, be sex chromosomes. Polyploid cells have multiple copies of chromosomes and haploid cells have single copies. The study of whole sets of chromosomes is sometimes known as karyology.
The chromosomes are depicted (by rearranging a microphotograph) in a standard format known as a karyogram or idiogram: in pairs, ordered by size and position of centromere for chromosomes of the same size. This may be used for many purposes; such as, to show genetic disease, what sex the animal is and its diploid number. In humans, cytologists have used karyotypes to help identify genetic abnormalities a baby might have before it is born.
Karyotypes may be studied to gather information about past evolutionary events, such as polyploidy.
Karyotype Media
Schematic karyogram demonstrating the basic knowledge needed to read a karyotype.
Chromosomes at various stages of mitosis. Karyograms are generally made by chromosomes in prometaphase or metaphase. During these phases, the two copies of each chromosome (connected at the centromere) will look as one unless the image resolution is high enough to distinguish the two.
Micrograph of human chromosomes before further processing. Staining with Giemsa confers a purple color to chromosomes, but micrographs are often converted to grayscale to facilitate data presentation and make comparisons of results from different laboratories.
Schematic karyogram of a human. Even at low magnification, it gives an overview of the human genome, with numbered chromosome pairs, its main changes during the cell cycle (top center), and the mitochondrial genome to scale (at bottom left). See section text for more details.
Karyogram from a human female lymphocyte probed for the Alu sequence using FISH.
References
- ↑ Concise Oxford Dictionary
- ↑ 2.0 2.1 White M.J.D. 1973. The chromosomes. 6th ed, Chapman & Hall, London. p28
- ↑ Stebbins G.L. 1950. Variation and evolution in plants. Chapter XII: The Karyotype. Columbia University Press N.Y.
- ↑ King R.C., Stansfield W.D. and Mulligan P.K. 2006. A dictionary of genetics. 7th ed, Oxford U.P Oxford & N.Y. p242


