Sampling (statistics)

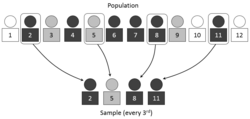
In statistics, a sample is part of a population. The sample is carefully chosen. It should represent the whole population fairly, without bias.
When treated as a data set, a sample is often represented by capital letters such as [math]\displaystyle{ X }[/math] and [math]\displaystyle{ Y }[/math], with its elements being represented in lowercase (e.g., [math]\displaystyle{ x_3 }[/math]), and the sample size being represented by the letter [math]\displaystyle{ n }[/math].[1]
The reason samples are needed is that populations may be so large that counting all the individuals may not be possible or practical. Therefore, solving a problem in statistics usually starts with sampling.[2] Sampling is about choosing which data to take for later analysis. As an example, suppose the pollution of a lake should be analysed for a study. Depending on where the samples of water were taken, the studies can have different results.
As a general rule, samples need to be random. This means the chance or probability of selecting one individual is the same as the chance of selecting any other individual.
In practice, random samples are always taken by means of a well-defined procedure. A procedure is a set of rules, a sequence of steps written down and exactly followed. Even so, some bias may remain in the sample. Consider the problem of designing a sample to predict the result of an election poll. All known methods have their problems, and the results of an election are often different from predictions based on a sample. If you collect opinions by using telephones, or by meeting people in the street, you won't ask people who don't answer phone calls or who don't walk on the street. Therefore, in cases like this a completely neutral sample is never possible.[3] In such cases a statistician will think about how to measure the amount of bias, and there are ways to estimate this.
A similar situation occurs when scientists measure a physical property, say the weight of a piece of metal, or the speed of light.[4] If we weigh an object with sensitive equipment we will get minutely different results. No system of measurement is ever perfect. We get a series of estimates, each one being a measurement. These are samples, with a certain degree of error. Statistics is designed to describe error, and carry out analysis on this kind of data.
There are different kinds of samples:
- A complete sample includes all the elements that have a given property.
- An unbiased or representative sample is produced by taking a complete sample and selecting elements from it, in a process that does not depend on the properties of the elements.
The way the sampling is obtained, along with the sample size, will have an impact on how the data is viewed.[5]
Stratified sampling
If a population has obvious sub-populations, then each of the sub-populations needs to be sampled. This is called stratified sampling. Stratified sampling is also known as stratified random sample. Stratified sampling is often represented as proportion, such as percent (%).
Suppose an experiment set out to sample the incomes of adults. Obviously, the incomes of college graduates might differ from that of non-graduates. Now suppose the number of male graduates was 30% of the total male adults (imaginary figures). Then you would arrange for 30% of the total sample to be male graduates picked at random, and 70% of the total to be male non-graduates. Repeat the process for females, because the percentage of female graduates is different from males. That gives a sample of the adult population stratified by sex and college education. The next step would be to divide each of your sub-populations by age groups, because (for example) graduates might gain more income relative to non-graduates in middle age.
Another type of stratified sample deals with variation. Here larger samples are taken from the more variable sub-populations so that the summary statistics such as the means and standard deviations, are more reliable.
Sampling (statistics) Media
Related pages
References
- ↑ "List of Probability and Statistics Symbols". Math Vault. 2020-04-26. Retrieved 2020-08-21.
- ↑ Lohr, Sharon L. 1999. Sampling: design and analysis. Duxbury.
- ↑ Kish, Leslie 1995. Survey sampling. Wiley, N.Y. ISBN 0-471-10949-5
- ↑ Stuart, Alan 1962. Basic ideas of scientific sampling. Hafner, New York.
- ↑ "What Is the Meaning of Sample Size?". Sciencing. Retrieved 2020-08-21.


