Cauchy distribution
In mathematics, the Cauchy-Lorentz distribution (after Augustin-Louis Cauchy and Hendrik Lorentz) is a continuous probability distribution with two parameters: a location parameter and a scale parameter.[1][2] As a probability distribution, it is usually called a Cauchy distribution. Physicists know it as a Lorentz distribution.
When the location parameter is 0 and the scale parameter is 1, the probability density function of the Cauchy distribution reduces to [math]\displaystyle{ f(x)= 1/[\pi (x^2+1)] }[/math]. This is called the standard Cauchy distribution.[2]
The Cauchy distribution is used in spectroscopy to describe the spectral lines found there, and to describe resonance.[3] It is also often used in statistics as the canonical example of a "pathological" distribution, since both its mean and its variance are undefined. The look of a Cauchy distribution is similar to that of a normal distribution, though with longer "tails".[4]
Due to this, estimating the mean value may not converge to any single value with more data (law of large numbers) unlike a normal distribution; due to a higher chance of getting extreme values (the tails of a frequency plot).
Cauchy Distribution Media
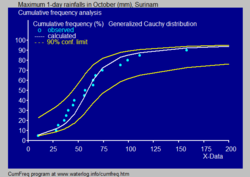
Fitted cumulative Cauchy distribution to maximum one-day rainfalls using CumFreq, see also distribution fitting
Related pages
References
- ↑ "List of Probability and Statistics Symbols". Math Vault. 2020-04-26. Retrieved 2020-10-13.
- ↑ 2.0 2.1 "1.3.6.6.3. Cauchy Distribution". www.itl.nist.gov. Retrieved 2020-10-13.
- ↑ "The Lorentz Oscillator Model". Archived from the original on 2014-04-22. Retrieved 2013-06-14.
- ↑ "Cauchy distribution | mathematics". Encyclopedia Britannica. Retrieved 2020-10-13.


