2016 United States presidential election in New Mexico
The 2016 United States presidential election in New Mexico was held on 8 November 2016. It was part of the 2016 United States presidential election, in which all other states plus the District of Columbia voted.
On 7 June 2016, the state also voted for who they wanted to be the nominee of their respective parties.
Presidential
Polling
Below is a table with the polling results in New Mexico. New Mexico has voted Democrat in the general election since 2008.
| Poll source | Date administered | Democrat | % | Republican | % | Libertarian | % | Green | % | Lead margin | Sample size | Margin of error |
|---|---|---|---|---|---|---|---|---|---|---|---|---|
| Zia Poll[1] | November 6, 2016 | Hillary Clinton | 46% | Donald Trump | 44% | Gary Johnson | 6% | Jill Stein | 1% | 2 | 8,439 | ± 1.8% |
| Research & Polling Inc[2] | November 1–3, 2016 | Hillary Clinton | 45% | Donald Trump | 40% | Gary Johnson | 11% | Jill Stein | 3% | 5 | 504 | ± 4.4% |
| Breitbart News/Gravis Marketing[3] | November 1–2, 2016 | Hillary Clinton | 45% | Donald Trump | 37% | Gary Johnson | 11% | Jill Stein | 3% | 8 | 1,327 | ± 2.7% |
| Zia Poll[4] | November 1–2, 2016 | Hillary Clinton | 46% | Donald Trump | 43% | Gary Johnson | 7% | Jill Stein | 1% | 3 | 1,102 | ± 3.0% |
| Zia Poll[5] | October 24, 2016 | Hillary Clinton | 45% | Donald Trump | 40% | Gary Johnson | 9% | Jill Stein | 2% | 5 | 1,899 | ± 2.25% |
| Zia Poll[6] | October 11, 2016 | Hillary Clinton | 46% | Donald Trump | 36% | Gary Johnson | 12% | Jill Stein | 2% | 10 | 1,536 | ± 2.5% |
| SurveyUSA[7] | September 28 – October 2, 2016 | Hillary Clinton | 46% | Donald Trump | 33% | Gary Johnson | 14% | Jill Stein | 2% | 13 | 594 | ± 4.1% |
| Research & Polling Inc | September 27–29, 2016 | Hillary Clinton | 35% | Donald Trump | 31% | Gary Johnson | 24% | Jill Stein | 2% | 4 | 501 | ± 4.4% |
Results
[8] Turnout was 62.36%.
| Presidential election | ||
|---|---|---|
| Choice | Votes | % |
| Hillary Clinton (DEM) | 385,234 | 48.26% |
| Donald Trump (REP) | 319,667 | 40.04% |
| Gary Johnson | 74,541 | 9.34% |
| Jill Stein | 9,879 | 1.24% |
| Evan McMullin | 5,825 | 0.73% |
| Darrell Castle | 1,514 | 0.19% |
| Gloria La Riva | 1,184 | 0.14% |
| Rocky De La Fuente | 475 | 0.06% |
| Total votes | 100.0% | |
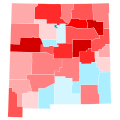
Results by county
| County | Clinton# | Clinton% | Trump# | Trump% | Johnson# | Johnson% | Stein# | Stein% | Total Votes |
|---|---|---|---|---|---|---|---|---|---|
| Bernalillo | 143,417 | 52.22% | 94,698 | 34.48% | 29,682 | 10.81% | 3,614 | 1.32% | 274,662 |
| Catron | 427 | 20.84% | 1,464 | 71.45% | 111 | 5.42% | 23 | 1.12% | 2,049 |
| Chaves | 5,534 | 27.30% | 12,872 | 63.50% | 1,609 | 7.94% | 86 | 0.42% | 20,271 |
| Cibola | 3,741 | 46.40% | 3,195 | 39.63% | 970 | 12.03% | 73 | 0.91% | 8,063 |
| Colfax | 2,129 | 39.93% | 2,585 | 48.48% | 527 | 9.88% | 37 | 0.69% | 5,332 |
| Curry | 3,121 | 23.34% | 9,035 | 67.58% | 973 | 7.28% | 74 | 0.55% | 13,370 |
| De Baca | 193 | 21.21% | 620 | 68.13% | 89 | 9.78% | 6 | 0.66% | 910 |
| Doña Ana | 37,947 | 53.71% | 25,374 | 35.92% | 5,471 | 7.74% | 953 | 1.35% | 70,648 |
| Eddy | 5,033 | 25.59% | 13,147 | 66.85% | 1,275 | 6.48% | 84 | 0.43% | 19,667 |
| Grant | 6,276 | 48.99% | 5,288 | 41.28% | 899 | 7.02% | 218 | 1.70% | 12,811 |
| Guadalupe | 970 | 53.09% | 595 | 32.57% | 238 | 13.03% | 18 | 0.99% | 1,827 |
| Harding | 156 | 29.60% | 311 | 59.01% | 55 | 10.44% | 3 | 0.57% | 527 |
| Hidalgo | 784 | 41.88% | 910 | 48.61% | 137 | 7.32% | 6 | 0.32% | 1,872 |
| Lea | 3,930 | 22.19% | 12,495 | 70.55% | 1,098 | 6.20% | 56 | 0.32% | 17,712 |
| Lincoln | 2,331 | 26.19% | 5,896 | 66.23% | 560 | 6.29% | 59 | 0.66% | 8,902 |
| Los Alamos | 5,562 | 51.10% | 3,359 | 30.86% | 1,512 | 13.89% | 120 | 1.10% | 10,885 |
| Luna | 3,195 | 43.80% | 3,478 | 47.68% | 481 | 6.59% | 66 | 0.90% | 7,295 |
| McKinley | 13,576 | 62.55% | 5,104 | 23.52% | 2,412 | 11.11% | 284 | 1.31% | 21,703 |
| Mora | 1,536 | 62.93% | 665 | 27.24% | 194 | 7.95% | 35 | 1.43% | 2,441 |
| Otero | 6,124 | 30.53% | 11,886 | 59.26% | 1,613 | 8.04% | 169 | 0.84% | 20,059 |
| Quay | 1,017 | 28.47% | 2,212 | 61.93% | 299 | 8.37% | 15 | 0.42% | 3,572 |
| Rio Arriba | 9,592 | 64.47% | 3,599 | 24.19% | 1,425 | 9.58% | 188 | 1.26% | 14,878 |
| Roosevelt | 1,454 | 24.44% | 3,884 | 65.28% | 482 | 8.10% | 48 | 0.81% | 5,950 |
| San Juan | 12,865 | 27.90% | 27,946 | 60.61% | 4,200 | 9.11% | 352 | 0.76% | 46,110 |
| San Miguel | 7,285 | 67.76% | 2,313 | 21.51% | 915 | 8.51% | 160 | 1.49% | 10,751 |
| Sandoval | 27,707 | 44.91% | 25,905 | 41.99% | 6,657 | 10.79% | 627 | 1.02% | 61,690 |
| Santa Fe | 50,793 | 71.10% | 14,332 | 20.06% | 4,362 | 6.11% | 1,452 | 2.03% | 71,434 |
| Sierra | 1,612 | 31.11% | 3,010 | 58.10% | 442 | 8.53% | 78 | 1.51% | 5,181 |
| Socorro | 3,313 | 48.24% | 2,616 | 38.09% | 802 | 11.68% | 60 | 0.87 | 6,868 |
| Taos | 10,668 | 69.91% | 2,727 | 17.87% | 1,179 | 7.73% | 617 | 4.04% | 15,260 |
| Torrance | 1,785 | 28.23% | 3,714 | 58.73% | 692 | 10.94% | 66 | 1.04% | 6,324 |
| Union | 320 | 18.80% | 1,216 | 71.45% | 134 | 7.87% | 13 | 0.76% | 1,702 |
| Valencia | 10,841 | 39.29% | 13,215 | 47.89% | 3,046 | 11.04% | 219 | 0.79% | 27,592 |
| Totals | 385,234 | 48.26% | 319,666 | 40.04% | 74,541 | 9.34% | 9,879 | 1.24% | 798,318 |
Primaries
Democratic
The Democratic primary occurred on 7 June 2016.
| Democratic primary | |||
|---|---|---|---|
| Choice | Votes | % | Delegates |
| Hillary Clinton | 111,334 | 51.53% | 27 |
| Bernie Sanders | 104,741 | 48.47% | 16 |
| Total votes | 216,075 | 100% | 43 |
Republican
The Republican primary occurred on 7 June 2016.
| Republican primary | |||
|---|---|---|---|
| Choice | Votes | % | Delegates |
| Donald Trump | 73,908 | 70.64% | 24 |
| Ted Cruz (withdrawn) | 13,925 | 13.31% | 0 |
| John Kasich (withdrawn) | 7,925 | 7.57% | 0 |
| Ben Carson (withdrawn) | 3,830 | 3.66% | 0 |
| Jeb Bush (withdrawn) | 3,531 | 3.37% | 0 |
| Carly Fiorina (withdrawn) | 1,508 | 1.44% | 0 |
| Total votes | 104,627 | 100% | 24 |
2016 United States Presidential Election In New Mexico Media

2020 U.S. House elections in New Mexico
Precinct level results for 2016 presidential election in New Mexico
Results by county showing number of votes by size and candidates by color

Treemap of the popular vote by county

Republican primary results by county:*Template:Collapsible list*
New Mexico County Swing 2016
New Mexico County Trend 2016
New Mexico County Flips 2016


Related pages
References
- ↑ "8,439 NM Likely Voters Surveyed: Clinton Holds on to Slim Lead Heading into Election Day" (PDF). Zia Poll. RCP. November 7, 2016. Retrieved November 7, 2016.
- ↑ "Journal Poll: Clinton still ahead in NM". Research & Polling Inc. Albuquerque Journal. November 5, 2016. Retrieved November 6, 2016.
- ↑ "Current New Mexico Polling". Gravis Marketing. Breitbart News. November 4, 2016. Retrieved November 8, 2016.
- ↑ "Trump Trails Clinton by Only 3 Points In New Mexico. Making up 2 Points Over The Last Week" (PDF). Zia Poll. RCP. November 3, 2016. Retrieved November 4, 2016.
- ↑ "Trump Narrows Gap in New Mexico. Trails by Only 5 Points Entering Last Two Weeks" (PDF). Zia Poll. FiveThirtyEight. October 27, 2016. Archived from the original (PDF) on October 28, 2016. Retrieved October 27, 2016.
- ↑ "Clinton Takes a 10 Point Lead in New Mexico Following Debate and Trump Tape Release. 9 of 10 Voters are Very Familiar with Trump Tape. 7 of 10 Very Familiar with Clinton Emails" (PDF). Zia Poll. FiveThirtyEight. October 18, 2016. Archived from the original (PDF) on October 19, 2016. Retrieved October 18, 2016.
- ↑ "New Mexico Whites Split, But Clinton Carries the State With Overwhelming Support from Latino Voters; Democrat Toulouse Oliver Well Positioned To Defeat Republican Espinoza in Secretary of State Contest:". SurveyUSA. KOB-TV Albuquerque. October 3, 2016. Retrieved October 6, 2016.
- ↑ "Election Night Results". Retrieved 2016-12-07.
Other websites
- RNC 2016 Republican Nominating Process Archived 2016-11-08 at the Wayback Machine
- Green papers for 2016 primaries, caucuses, and conventions
- 2016 Presidential primaries Archived 2015-11-17 at the Wayback Machine, ElectionProjection.com