2016 United States presidential election in New Jersey
(Redirected from United States presidential election in New Jersey, 2016)
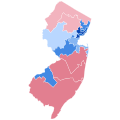
The 2016 United States presidential election in New Jersey was held on 8 November 2016. It was part of the 2016 United States presidential election, in which all other states plus the District of Columbia voted.
On 7 June 2016, the state also voted for who they wanted to be the nominee of their respective parties.
Presidential
Polling
Below is a table with the polling results in New Jersey. New Jersey has voted Democrat in every general election since 1992.
| Race | Poll model | Hillary Clinton Democratic |
Donald Trump Republican |
Gary Johnson Libertarian |
Jill Stein Green |
Lead margin |
|---|---|---|---|---|---|---|
| Two-way | 270 to Win Archived 2017-01-06 at the Wayback Machine | 52% | 38.3% | N/A | 13.7 | |
| Election Projection Archived 2016-11-15 at the Wayback Machine | 48.5% | 40% | 8.5 | |||
| HuffPost Pollster Archived 2016-12-27 at the Wayback Machine | 48.1% | 35% | 13.1 | |||
| Real Clear Politics | 50.8% | 39.5% | 11.3 | |||
| TPM Polltracker Archived 2016-11-07 at the Wayback Machine | 50.3% | 38% | 12.3 | |||
| Votamatic | 56.6% | 43.4% | 13.2 | |||
| Three-way | Election Projection Archived 2017-08-31 at the Wayback Machine | 44% | 32% | 9% | N/A | 12 |
| Electoral Vote | 49% | 35% | 6% | 14 | ||
| FiveThirtyEight Archived 2016-10-31 at Archive.today | 54.3% | 40.1% | 4.1% | 14.2 | ||
| TPM Polltracker Archived 2016-11-07 at the Wayback Machine | 47% | 43% | 5% | 4 | ||
| Four-way | Election Projection Archived 2016-11-10 at the Wayback Machine | 48.7% | 35.3% | 6.3% | 3% | 13.4 |
| Real Clear Politics | 48.5% | 36% | 5.5% | 3% | 12.5 | |
| TPM Polltracker Archived 2016-11-07 at the Wayback Machine | 47% | 43% | 5% | 2% | 4 | |
Results
| Presidential election | ||
|---|---|---|
| Choice | Votes | % |
| Hillary Clinton (DEM) | 2,148,278 | 55.45% |
| Donald Trump (REP) | 1,601,933 | 41.35% |
| Gary Johnson | 72,477 | 1.87% |
| Jill Stein | 37,772 | 0.98% |
| Darrell Castle | 6,161 | 0.16% |
| others | 7,425 | 0.19% |
| Total votes | 3,874,046 | 100% |
Caucuses
Democratic
The Democratic caucus occurred on 7 June 2016.
| Presidential election | |||
|---|---|---|---|
| Choice | Votes | % | Delegates |
| Hillary Clinton | 566,247 | 63.32% | 91 |
| Bernie Sanders | 328,058 | 36.68% | 49 |
| Uncommitted | 0 | ||
| Total votes | 100% | 142 | |
Republican
The Republican caucus occurred on 7 June 2016.
| Presidential election | |||
|---|---|---|---|
| Choice | Votes | % | Delegates |
| Donald Trump | 360,212 | 80.41% | 51 |
| withdrawn candidates | 87,740 | 19.59% | 0 |
| Total votes | 447,952 | 100% | 51 |
2016 United States Presidential Election In New Jersey Media
Vote share by Legislative district*Template:Collapsible list**Template:Collapsible list*
New Jersey County Swing 2016
New Jersey County Trend 2016


