2016 United States presidential election in Arizona
The 2016 United States presidential election in Arizona was held on 8 November 2016. It was part of the 2016 United States presidential election, in which all other states plus the District of Columbia voted.
On 22 March and 5 April 2016, the state also voted for who they wanted to be the nominee of their respective parties.
Presidential
Polling
Below is a table with the polling results in Arizona. Arizona has voted Republican in the general election since 2000.
| Poll source | Date administered | Democrat | % | Republican | % | Lead margin | Sample size | Margin of error |
|---|---|---|---|---|---|---|---|---|
| NBC News/Wall Street Journal/Marist[1] | October 30 – November 1, 2016 | Hillary Clinton | 41% | Donald Trump | 46% | 5 | 719 | ± 3.7% |
| CNN/ORC[2] | October 27 – November 1, 2016 | Hillary Clinton | 46% | Donald Trump | 51% | 5 | 769 | ± 3.5% |
| Ipsos/Reuters[3] | October 6–18, 2016 | Hillary Clinton | 38% | Donald Trump | 45% | 7 | 1,538 | ± 2.8% |
| NBC News/Wall Street Journal/Marist[4] | September 6–8, 2016 | Hillary Clinton | 41% | Donald Trump | 42% | 1 | 649 | ± 3.8% |
Results
[5] Turnout was 74.17%.
| Presidential election | ||
|---|---|---|
| Choice | Votes | % |
| Donald Trump (REP) | 1,252,401 | 49.03% |
| Hillary Clinton (DEM) | 1,161,167 | 45.46% |
| Gary Johnson | 106,327 | 4.16% |
| Jill Stein | 34,345 | 1.34% |
| Total votes | 2,554,240 | 100.0% |
Results by county
| County | Trump# | Trump% | Clinton# | Clinton% | Johnson# | Johnson% | Stein# | Stein% | Total Votes |
|---|---|---|---|---|---|---|---|---|---|
| Apache | 8,240 | 30.50% | 17,083 | 63.24% | 1,221 | 4.52% | 469 | 1.74% | 27,013 |
| Cochise | 28,092 | 57.41% | 17,450 | 35.66% | 2,394 | 4.89% | 993 | 2.03% | 48,929 |
| Coconino | 21,108 | 36.45% | 32,404 | 56.44% | 2,978 | 5.14% | 1,414 | 2.44% | 57,904 |
| Gila | 14,182 | 63.88% | 7,003 | 31.55% | 803 | 3.62% | 212 | 0.95% | 22,200 |
| Graham | 8,025 | 67.22% | 3,301 | 27.65% | 497 | 4.16% | 116 | 0.97% | 11,939 |
| Greenlee | 1,892 | 58.34% | 1,092 | 33.67% | 200 | 6.17% | 59 | 1.82% | 3,243 |
| La Paz | 4,003 | 68.29% | 1,575 | 26.87% | 211 | 3.60% | 73 | 1.25% | 5,862 |
| Maricopa | 747,361 | 48.63% | 702,907 | 45.74% | 67,043 | 4.36% | 19,432 | 1.26% | 1,536,743 |
| Mohave | 58,282 | 73.67% | 17,455 | 22.06% | 2,639 | 3.34% | 740 | 0.94% | 79,116 |
| Navajo | 20,577 | 52.56% | 16,459 | 42.04% | 1,410 | 3.60% | 703 | 1.80% | 39,149 |
| Pima | 167,428 | 40.45% | 224,661 | 54.28% | 15,620 | 3.77% | 6,200 | 1.50% | 413,909 |
| Pinal | 72,819 | 57.25% | 47,892 | 37.65% | 5,010 | 3.94% | 1,467 | 1.15% | 127,197 |
| Santa Cruz | 3,897 | 24.45% | 11,690 | 71.58% | 432 | 2.66% | 221 | 1.36% | 16,240 |
| Yavapai | 71,330 | 63.40% | 35,590 | 31.63% | 3,996 | 3.55% | 1,588 | 1.41% | 112,504 |
| Yuma | 25,165 | 48.12% | 24,605 | 47.05% | 1,873 | 3.58% | 649 | 1.24% | 52,292 |
Primaries
Democratic
The Democratic primary occurred on 5 April 2016.
| Presidential election | |||
|---|---|---|---|
| Choice | Votes | % | Delegates |
| Hillary Clinton | 262,459 | 56.29% | 48 |
| Bernie Sanders | 192,962 | 41.39% | 34 |
| Martin O'Malley (withdrawn) | 3,877 | 0.83% | 0 |
| Rocky De La Fuente | 2,797 | 0.60% | 0 |
| Michael Steinberg | 2,295 | 0.49% | 0 |
| Henry Hewes | 1,845 | 0.40% | 0 |
| Uncommitted | 3 | ||
| Total votes | 466,235 | 100% | 85 |
Republican
The Republican primary occurred on 22 March 2016.
| Presidential election | |||
|---|---|---|---|
| Choice | Votes | % | Delegates |
| Donald Trump | 286,743 | 45.95% | 58 |
| Ted Cruz | 172,294 | 27.61% | 0 |
| Marco Rubio (withdrawn) | 72,304 | 11.59% | 0 |
| John Kasich | 65,965 | 10.57% | 0 |
| Ben Carson (withdrawn) | 14,940 | 2.39% | 0 |
| Others | 11,793 | 1.89% | 0 |
| Total votes | 624,039 | 100% | 58 |
2016 United States Presidential Election In Arizona Media
Former Secretary of State Hillary Clinton at a campaign rally at Carl Hayden High School in Phoenix on March 21, 2016.
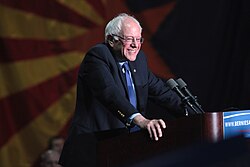
Senator Bernie Sanders at a campaign rally at the Phoenix Convention Center in Phoenix on March 15, 2016.
Former President Bill Clinton at a campaign rally for his wife at Central High School in Phoenix on March 20, 2016.
Businessman Donald Trump at a campaign rally at Fountain Park in Fountain Hills on March 19, 2016.
Related pages
References
- ↑ "Polls: Trump Ahead in Arizona and Texas, Deadlocked in Georgia". Wall Street Journal/Marist College. NBC News. November 3, 2016. Retrieved November 4, 2016.
- ↑ "CNN/ORC International Poll Arizona" (PDF). ORC International. CNN. November 2, 2016. Retrieved November 3, 2016.
- ↑ "State Poll: Arizona". Reuters. Ipsos. October 19, 2016. Archived from the original on October 26, 2016. Retrieved October 25, 2016.
- ↑ "Clinton, Trump Deadlocked in Battleground States: Polls". Marist. NBC News/Wall Street Journal. September 11, 2016. Retrieved September 11, 2016.
- ↑ 5.0 5.1 "Arizona Secretary of State Election Night Reporting". Results.arizona.vote. Retrieved 2016-11-20.
Other websites
- RNC 2016 Republican Nominating Process Archived 2016-11-08 at the Wayback Machine
- Green papers for 2016 primaries, caucuses, and conventions
- 2016 Presidential primaries Archived 2015-11-17 at the Wayback Machine, ElectionProjection.com


