New York's 27th congressional district
The 27th congressional district of New York is a congressional district for the United States House of Representatives in western New York. It includes all of Orleans, Genesee, Wyoming, and Livingston counties and parts of Erie, Monroe, Niagara, and Ontario counties. The district was last represented by Republican Chris Jacobs from 2020 until 2023. The district used to be represented by Republican Chris Collins but he left his job after he was found guilty of insider trading a special election was held to take Chris Collin's job. Chris Jacobs won the election.
| New York's 27th congressional district | |||
|---|---|---|---|
| Obsolete | |||
| Representative |
| ||
| Created | 1820 Census | ||
| Eliminated | 2020 Census | ||
| Years | 1823–2023 | ||
Election history
| Year | Office | Results |
|---|---|---|
| 1992 | President | Bush 42–33% |
| 1996 | President | Clinton 43–43% |
| 2000 | President | Gore 53–41% |
| 2004 | President | Kerry 53–45% |
| 2008 | President | McCain 54–44% |
| 2012 | President | Romney 55.3–42.9% |
| 2016 | President | Trump 59.7–35.2% |
| 1996 United States House of Representatives elections in New York: District 27 | |||||
|---|---|---|---|---|---|
| Party | Candidate | Votes | % | ±% | |
| Republican | Bill Paxon | 142,568 | 59.9% | ||
| Democratic | Thomas M. Fricano | 95,503 | 40.1% | ||
| Majority | 47,065 | 19.8% | |||
| Turnout | 238,071 | 100% | |||
| 1998 United States House of Representatives elections in New York: District 27 | |||||
|---|---|---|---|---|---|
| Party | Candidate | Votes | % | ±% | |
| Republican | Thomas M. Reynolds | 102,042 | 57.3% | −2.6% | |
| Democratic | Bill Cook | 75,978 | 42.7% | +2.6% | |
| Majority | 26,064 | 14.6% | −5.2% | ||
| Turnout | 178,020 | 100% | −25.2% | ||
| 2000 United States House of Representatives elections in New York: District 27 | |||||
|---|---|---|---|---|---|
| Party | Candidate | Votes | % | ±% | |
| Republican | Thomas M. Reynolds | 157,694 | 69.3% | +12.0% | |
| Democratic | Thomas W. Pecoraro | 69,870 | 30.7% | −12.0% | |
| Majority | 87,824 | 38.6% | +24.0% | ||
| Turnout | 227,564 | 100% | +27.8% | ||
| 2002 United States House of Representatives elections in New York: District 27 | |||||
|---|---|---|---|---|---|
| Party | Candidate | Votes | % | ±% | |
| Republican | Jack Quinn | 120,117 | 69.1% | −0.2% | |
| Democratic | Peter Crotty | 47,811 | 27.5% | −3.2% | |
| Right to Life | Thomas Casey | 3,586 | 2.1% | +2.1% | |
| Lua error in package.lua at line 80: module 'Module:Political party/G' not found. | Albert N. LaBruna | 2,405 | 1.4% | +1.4% | |
| Majority | 72,306 | 41.6% | +3.0% | ||
| Turnout | 173,919 | 100% | −23.6% | ||
| 2004 United States House of Representatives elections in New York: District 27 | |||||
|---|---|---|---|---|---|
| Party | Candidate | Votes | % | ±% | |
| Democratic | Brian Higgins | 143,332 | 50.7% | +23.2% | |
| Republican | Nancy A. Naples | 139,558 | 49.3% | −19.8% | |
| Majority | 3,774 | 1.3% | −40.3% | ||
| Turnout | 282,890 | 100% | +62.7% | ||
| 2006 United States House of Representatives elections in New York: District 27 | |||||
|---|---|---|---|---|---|
| Party | Candidate | Votes | % | ±% | |
| Democratic | Brian Higgins | 140,027 | 79.3% | +28.6% | |
| Republican | Michael J. McHale | 36,614 | 20.7% | −28.6% | |
| Majority | 103,413 | 58.5% | +57.2% | ||
| Turnout | 176,641 | 100% | −37.6% | ||
| 2008 United States House of Representatives elections in New York: District 27 | |||||
|---|---|---|---|---|---|
| Party | Candidate | Votes | % | ±% | |
| Democratic | Brian Higgins | 185,713 | 74.4% | −4.9% | |
| Republican | Daniel J. Humiston | 56,354 | 22.6% | +1.9% | |
| Conservative | Harold W. Schroeder | 7,478 | 3% | +3% | |
| Majority | 129,359 | 51.8% | −6.7% | ||
| Turnout | 249,545 | 100% | +41.3% | ||
| 2010 United States House of Representatives elections in New York: District 27 | |||||
|---|---|---|---|---|---|
| Party | Candidate | Votes | % | ±% | |
| Democratic | Brian Higgins | 119,085 | 60.9% | −13.5% | |
| Republican | Leonard A. Roberto | 76,320 | 39.1% | +16.5% | |
| Majority | 42,765 | 21.9% | 29.9% | ||
| Turnout | 195,405 | 100% | −21.7% | ||
| 2012 United States House of Representatives elections in New York: District 27 | |||||
|---|---|---|---|---|---|
| Party | Candidate | Votes | % | ±% | |
| Republican | Chris Collins | 161,220 | 50.8% | +11.7% | |
| Democratic | Kathy Hochul | 156,219 | 49.2% | −11.7% | |
| Majority | 5,001 | 1.6% | −20.3% | ||
| Turnout | 317,439 | 100% | +62.4% | ||
| 2014 United States House of Representatives elections in New York: District 27 | |||||
|---|---|---|---|---|---|
| Party | Candidate | Votes | % | ±% | |
| Republican | Chris Collins | 144,675 | 71.1% | +20.3% | |
| Democratic | Jim O'Donnell | 58,911 | 28.9% | −20.3% | |
| Majority | 85,764 | 42.2% | +40.6% | ||
| Turnout | 203,586 | 100% | −35.9% | ||
| 2016 United States House of Representatives elections in New York: District 27 | |||||
|---|---|---|---|---|---|
| Party | Candidate | Votes | % | ±% | |
| Republican | Chris Collins | 220,885 | 67.2% | −3.9% | |
| Democratic | Diana Kastenbaum | 107,832 | 32.8% | +3.9% | |
| Majority | 113,053 | 34.4% | −7.8% | ||
| Turnout | 328,717 | 100% | +61.4% | ||
| 2018 United States House of Representatives elections in New York: District 27 | |||||
|---|---|---|---|---|---|
| Party | Candidate | Votes | % | ±% | |
| Republican | Chris Collins | 140,146 | 49.1% | −18.1% | |
| Democratic | Nate McMurray | 139,059 | 48.8% | +16% | |
| Reform | Larry Piegza | 5,973 | 2.1% | +2.1% | |
| Majority | 1,087 | 0.3% | −34.1% | ||
| Turnout | 285,178 | 100% | −13.2% | ||
| 2020 New York's 27th congressional district special election[1] | |||||
|---|---|---|---|---|---|
| Party | Candidate | Votes | % | ±% | |
| style="background-color: Template:United States political party color; width: 5px;" | | Republican | Chris Jacobs | 81,036 | 51.8% | +2.7% |
| Democratic | Nathan McMurray | 72,787 | 46.5% | -2.3% | |
| Libertarian | Duane Whitmer | 1,498 | 1.0% | +1.0% | |
| Lua error in package.lua at line 80: module 'Module:Political party/G' not found. | Michael Gammariello | 1,043 | 0.7% | +0.7% | |
| Turnout | 156,364 | ||||
New York's 27th Congressional District Media
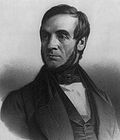
Daniel Dewey Barnard, Congressman from New York
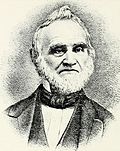
John De Mott, Congressman from New York

William A. Sackett (New York Congressman)

John James Taylor, New York Congressman and Judge

John Mason Parker, New York Congressman and Judge

Alexander S. Diven as Colonel of the 107th New York Infantry Regiment, 1863.

Photograph of the US politician, soldier and diplomat Robert B. Van Valkenburgh (1821–1888). From the Brady-Handy photograph collection at the Library of Congress.

Hamilton Ward, Sr., Member of Congress from New York

Horace B. Smith, Congressman from New York


.jpg)


References
- ↑ "New York Special Election Results: 27th Congressional District" (in en-US). The New York Times. . https://www.nytimes.com/interactive/2020/06/23/us/elections/results-new-york-house-district-27-special-general-election.html. Retrieved 2020-07-19.